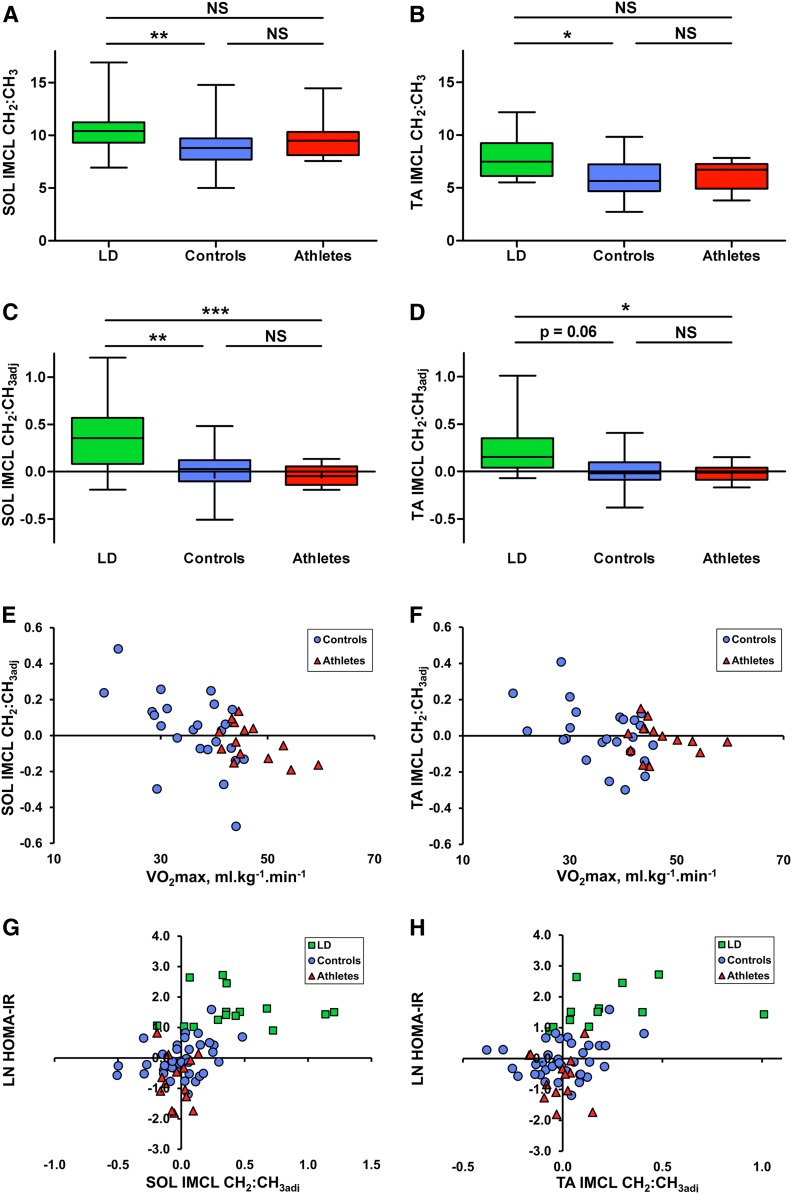
Fig. 4.
1H MRS measures of IMCL composition in LD subjects (green), controls (blue), and athletes (red). A, B: Box and whisker plots of (A) SOL and (B) TA IMCL compositional saturation index (CH2:CH3 ratio), as assessed by ANOVA and Games-Howell post hoc analyses. C, D: SOL and TA IMCL compositional saturation index adjusted for quantity. E, F: Relation of SOL and TA IMCL compositional adjusted saturation index with VO2max in the subset of participants who underwent VO2max testing, as assessed by Pearson’s correlation coefficient (controls: blue circles, n = 24; athletes: red triangles, n = 14). There was a significant correlation in the SOL (r = −0.546, P = 0.006) and TA (r = −0.453, P = 0.026) for controls alone, in the SOL (r = −0.558, P = 0.038) for athletes alone, and in the SOL (r = −0.520, P = 0.001) and TA (r = −0.362, P = 0.025) for controls and athletes combined. G, H: Relation of HOMA-IR with SOL and TA IMCL compositional adjusted saturation index. Correlation coefficients are shown in Table 2. *P < 0.05, **P < 0.01, and ***P < 0.001.

