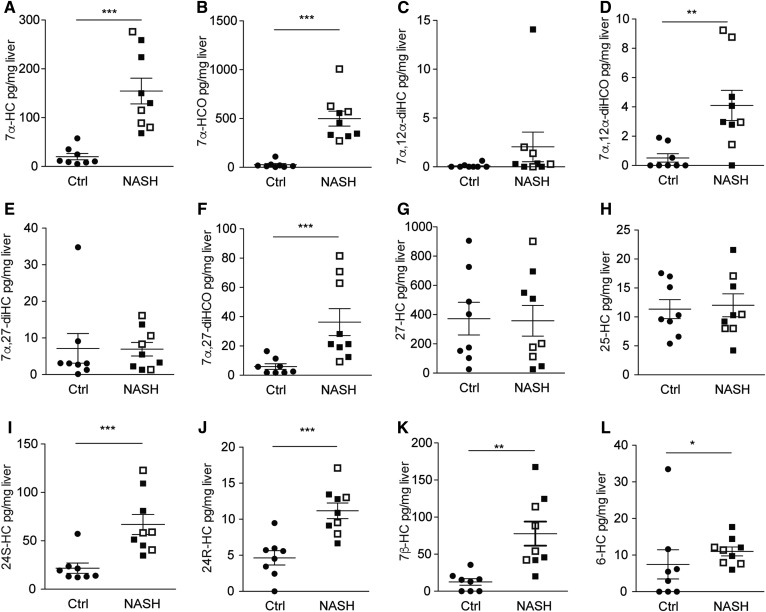
Fig. 1.
Liver oxysterol levels in patients with NASH versus controls. Levels of various oxysterols were determined in human liver samples from nine patients with NASH (black squares: with fibrosis; white squares: no fibrosis) and eight controls. Statistical analysis: Mann-Whitney U test. ***P < 0.001, **P < 0.01, and *P < 0.05.

