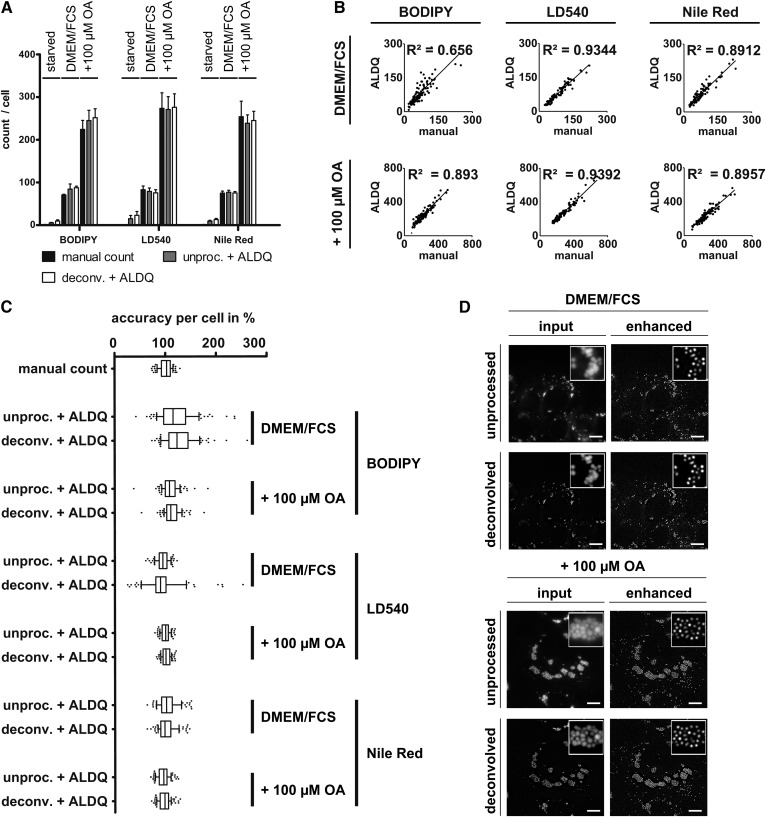
Fig. 2.
Quantification of LDs stained by lipophilic dyes in A431 cells. A431 cells were delipidated (starved) or cultured without (DMEM/FCS) or with (+100 μM OA) oleate supplementation for 24 h. LDs were counterstained with BODIPY493/503, LD540, or Nile Red. To assess the impact of image noise, the images were either deconvolved (deconv.) or left unprocessed (unproc.) and subsequently analyzed by ALDQ. A: Congruency of LD number detection by two independent quantitation techniques in A431 cells. LDs were manually counted (manual count) to which the ALDQ derived number (unproc. + ALDQ) was compared. Automatically determined LD numbers were highly similar to the manual count independent of the metabolic state. Suppression of image noise (deconv. + ALDQ) did not affect the results notably. Bars represent the mean ± SD of n = 2 independent experiments including 100 cells. B: Linear regression. The number of LDs derived by manual counting (x axis) was plotted against the number determined by ALDQ (y axis). Linear regression shows a strong correlation of both counting methods with indicated coefficients of determination (R2). Each analysis included the coordinates of 100 analyzed cells from n = 2 independent experiments. C: ALDQ accuracy is similar to manual counting accuracy. The LD number determined by ALDQ was plotted as a percentage of each cell’s manual LD count. Slim boxes and medians close to 100% indicate a precise LD detection per cell by ALDQ. Remarkably, the deviation per cell by ALDQ is often highly similar to the deviation of two examiners (“manual count”; see also the Materials and Methods). Similar to A, accuracy changes by prior deconvolution (deconv. + ALDQ) could not be observed. Each boxplot includes 100 cells in total from n = 2 independent experiments. D: Heavy clustering of LDs is resolved by preprocessing iterations. Representative images of LD540-stained A431 cells under standard growth condition (DMEM/FCS) and after oleate supplementation (+100 μM OA). A431 cells show extensive clustering of cytosolic LDs. The LDs were enhanced with twelve iterations (enhanced), which resolved the LD clusters. Note that prior deconvolution (deconvolved) can facilitate LD separation by reducing image noise, but does not affect the enhancement result by ALDQ (enhanced) perceptibly compared with raw images (unprocessed). Scale bar 10 μm.

