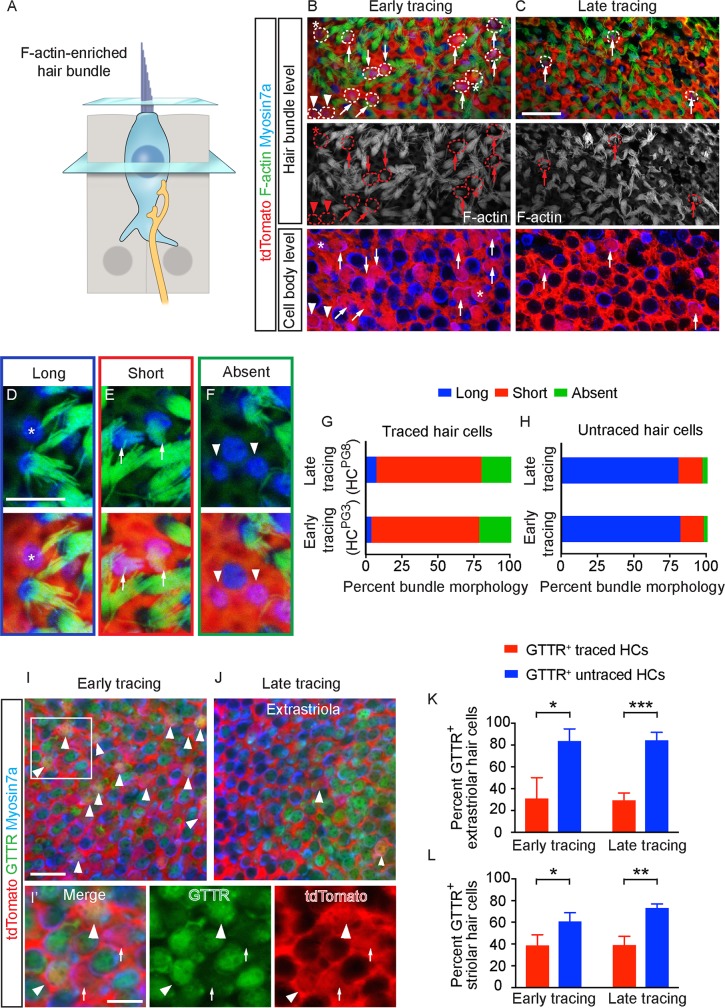
Fig 4. Bundle features of early and late postnatally generated hair cells.
A) Diagram illustrating hair cell stereociliary bundles. B-C) tdTomato+/Myosin7a+ hair cells (dashed circles) added from early and late tracing with long (asterisks), short (arrows) and absent bundles (arrowheads) in both the hair bundle and cell body level. D-F) High magnification images of representative cells with long (D, asterisks), short (E, arrows) and absent bundles (F, arrowheads). G-H) Proportion of bundle morphology in traced and untraced hair cells. The majority of traced hair cells had short bundles from early (n = 127 HCs from 4 mice) and late tracing (n = 96 from 8 mice), whereas majority of untraced hair cells had long bundles (n = 849 HCs from 4 mice at P3, 794 HCs from 8 mice at P8). I-J) Representative confocal images of GTTR+/tdTomato+/Myosin7a+ (arrowhead) and GTTR-/tdTomato+/Myosin7a+ (arrows) hair cells from early and late tracing. I’) High magnification images of panel I. K-L) Significantly more untraced hair cells than traced hair cells were GTTR-labeled in both early (n = 117 and 48 traced HCs, 649 and 700 untraced HCs from 3 mice in the extrastriola and striola) and late tracing experiments (n = 30 and 16 traced HCs, 951 and 740 untraced HCs from 4 mice in the extrastriola and striola). Data shown as mean ± SD, compared using Student t tests. ***p < 0.001, **p < 0.01, *p < 0.05. Scale bars: B-C, I-J) 20 μm; D-F, I’) 10 μm. The underlying data can be found within S1 Data. P, postnatal day.

