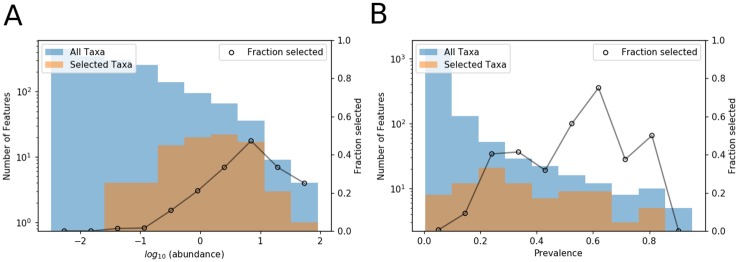
Fig 3. Distributions of bacterial abundance and prevalence of all taxa and the consensus set of taxa selected by all methods.
(A) Histogram of abundance of taxa in the consensus set plotted over a histogram of abundance of all taxa in the data set. Abundance was calculated as the average number of taxa over the entire sample set. (B) Histogram of prevalence of taxa in the consensus set plotted over a histogram of prevalence of all taxa in the data set. Prevalence was calculated based on how frequently taxa were present in each sample.

