
Fig 4. Distribution of prediction errors for 50 different permutations of training and testing data.
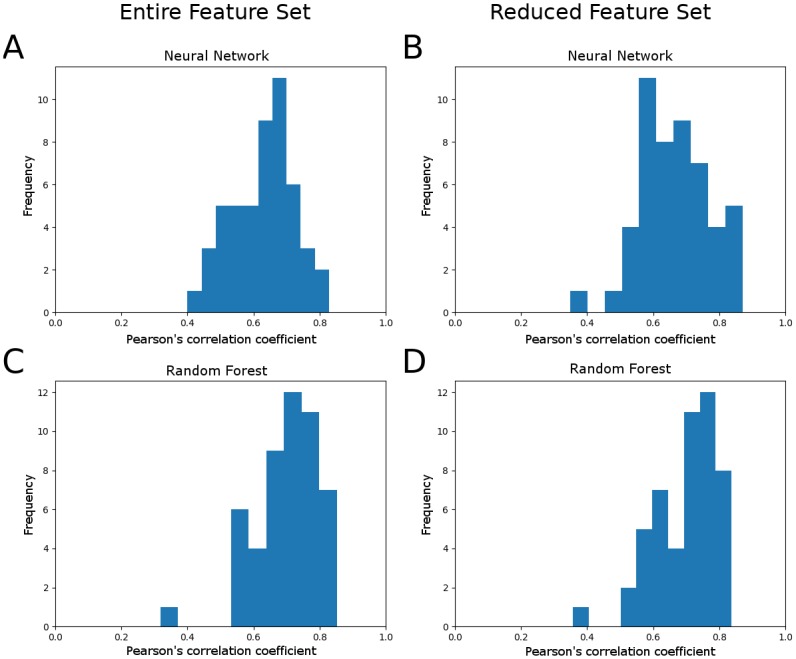
(A) Distribution of Pearson’s correlation coefficients on test data performance using the neural network model without feature reduction. Mean R value = .627, standard deviation = .097. (B) Distribution of Pearson’s correlation coefficients on test data performance using the neural network model with the reduced feature set. Mean R value = .668, standard deviation = .103. (C) Distribution of Pearson’s correlation coefficients on test data performance using the random forest model without feature reduction. Mean R value = .699, standard deviation = .100. (D) Distribution of Pearson’s correlation coefficients on test data performance using the random forest model with the reduced feature set. Mean R value = .700, standard deviation = .095. For these permutations, feature reduction improved neural network prediction performance (two tailed t-test, P = 0.047), and random forest outperformed neural network with the full feature set (two tailed t-test, P < 0.001) and with the reduced feature set (two tailed t-test, P = 0.11).