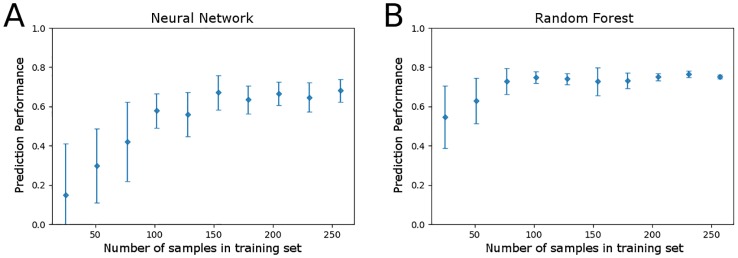
Fig 5. Sensitivity analysis of model prediction performance as the fraction of the total training data set (n = 257) increases.
Performance was measured using the average Pearson’s correlation coefficient after training over 10 random samplings of a fraction of the data set, with error bars representing 1 standard deviation from the mean. (A) Prediction performance on fixed testing data by the neural network model. (B) Prediction performance on fixed testing data by the random forest model.

