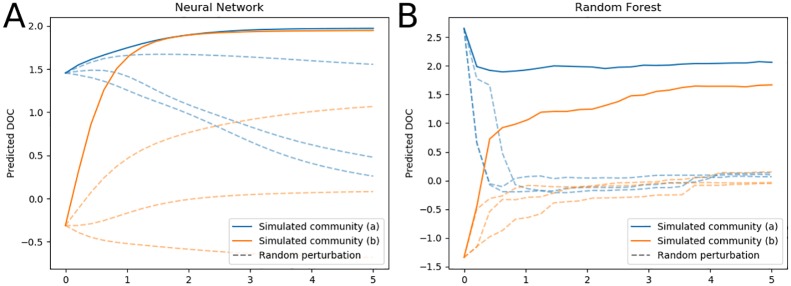
Fig 6. DOC predictions of trained machine learning models with synthesized microbial communities.
Simulated communities (a) and (b) were specified by the training data communities with the highest and lowest DOC values, respectively. Each was then adjusted in the direction of the average gradient of maximum DOC increase determined by the neural network model, and each perturbation was scaled by magnitude α. Dashed lines stemming from the initial values of communities (a) and (b) represent DOC predictions from communities adjusted by a random vector with similar magnitude. (A) DOC prediction from hypothetical bacterial communities made by the neural network. (B) DOC prediction made by the random forest model with identical communities used in panel A.

