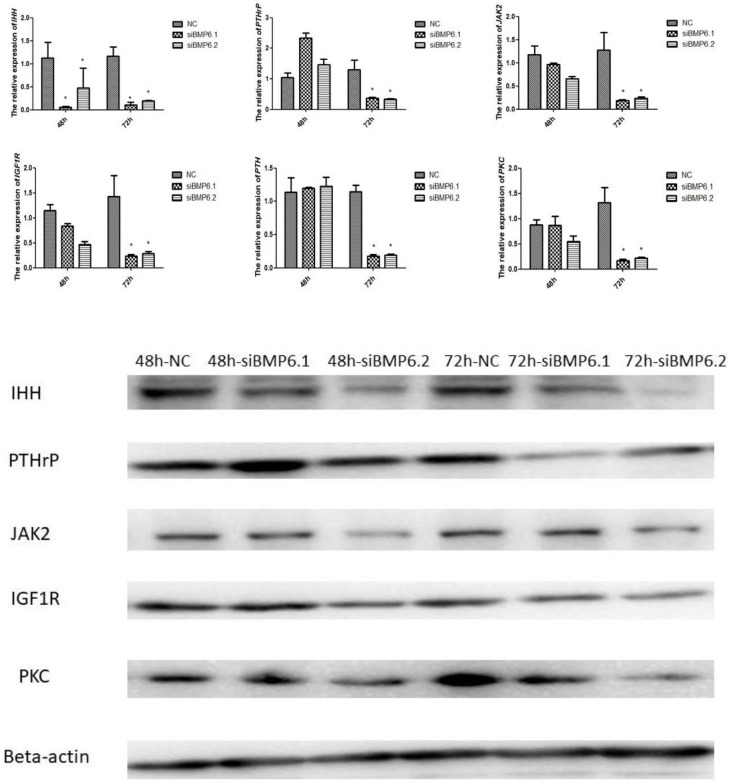
Fig 9. The mRNA expression of selected genes in cartilage cells after siRNA treatment were significantly decreased.
(A) The expression levels of genes mRNA by qRT-PCR. All values represent means ± SEM (n = 3). (*) represents statistical significance (P < 0.05). (B) The expression levels of proteins by western blot. The protein beta-actin was used as reference gene.

