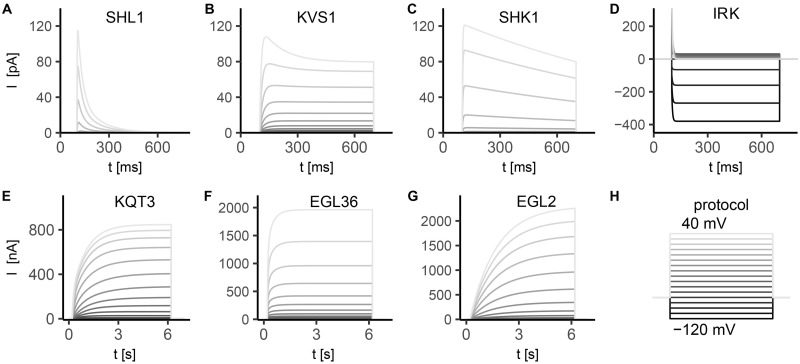
Fig 1. Simulated currents of the voltage-gated potassium channels SHL-1, KVS-1, SHK-1, IRK-1/3, KQT-3, EGL-36 and EGL-2.
Potassium currents present two different timescales for activation: some of them have fast activation (panels A-D, ), others have slow activation (panels E-G, ∼100 ms ). Stimulation protocol (sketched in panel H) consists in 10 mV voltage steps, from -120 mV to 40 mV. Each step lasts 600 ms for fast activating currents (panels A-D) and 6 s for slow activating ones (panels E-G). The holding potential is assumed equal to potassium reversal potential, i.e. Vh = −80 mV. The currents are expressed in pA (panels A-D) or nA (panels E-G), depending on the experimental data used as reference. The simulated currents in panels A-G are given by Eqs A5, A9, A14, A30, A21, A27, and A24 in S1 File, respectively, in which the conductances are assumed as follows: , , , , , , and . A) SHL1 current. Experimental data from [25]. Activation time constant is at V = −10 mV (Eq A2 in S1 File, S1 Fig). Current inactivation is described by the sum of two exponential functions, with time constants and at V > −10 mV for fast and slow components (Eq A4 in S1 File, S1 Fig). B) KVS1 current. Experimental data from [31]. KVS1 current activates significantly at positive potentials, with a time constant at 0 mV (Eq A8 in S1 File, S1 Fig). The current inactivates exponentially with a time constant that is a decreasing function of voltage ( at 0 mV, S1 Fig). C) SHK1 current. Experimental data for steady-state activation and inactivation variables from [25], and from [29] for time constants. SHK1 current shows fast activation for depolarizing potentials ( at 0 mV, Eq A11 in S1 File), followed by exponential inactivation with a voltage independent time constant (Eqs A12 and A13 in S1 File, S2 Fig). D) IRK current. Experimental data from [33–35]. The activation kinetics is described by a Boltzmann function (Eq A28 in S1 File) that is almost null at positive potentials and saturates at very negative potentials (V < −100 mV) (S2 Fig). The activation time constant voltage dependence is described by an asymmetric bell-shaped curve (Eq A29 in S1 File) with a peak of 8 ms at ∼-40 mV, and decreases to values below 4 ms for positive voltages (S2 Fig). E) KQT3 current. Experimental data from [26]. KQT3 current is characterized by the sum of two exponential functions with fast ( at V ∼ −20 mV, Eq A16 in S1 File) and slow ( at V ∼ −20 mV, Eq A17 in S1 File) activation components that account respectively for 30% and 70% of the total current (see S1 Fig). Inactivation is described by Eq A18 in S1 File [73]. F) EGL36 current. Experimental data from [30]. The current activates at high voltages V > 10 mV (S2 Fig) with three almost equally-weighted components at fast (13 ms), medium (63 ms) and slow (355 ms) timescales. Steady-state activation variable (Eq A25 in S1 File, S2 Fig) is shifted towards lower potentials (V0.5 = 6.9 mV) compared to SHL1, SHK1 and KVS1. G) EGL2 current. Experimental data from [28]. EGL2 current is slow activating () and non-inactivating. The activation function is described by a Boltzmann function with slow rise (ka = 14.9 mV) between -40 mV and 40 mV (Eq A22 in S1 File, S2 Fig). Activation time constant is weakly dependent on voltage, becoming almost constant for the considered voltages (Eq A23 in S1 File, S2 Fig). H) Simulation protocol. 10 mV voltage steps, range -120 mV to 40 mV, step duration 600 ms or 6 s.

