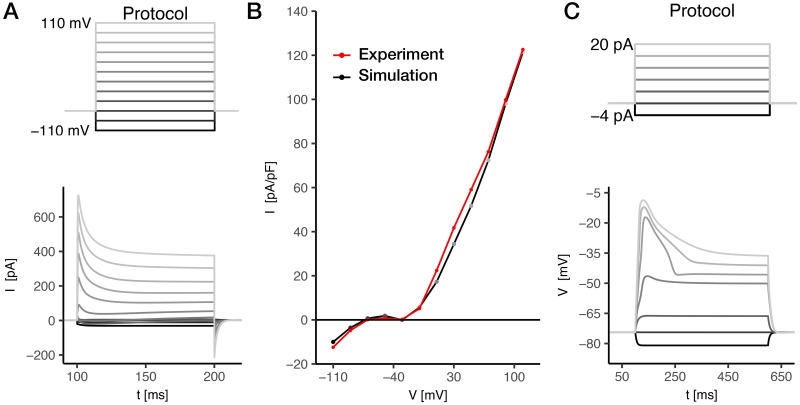
Fig 4. AWCON response to current and voltage stimuli.
A) Voltage clamp simulation of the AWCON neuron. Experimental data from [59]. To test the model we apply to the in silico neuron the same voltage clamp stimulation protocol of experimental whole-cell recordings [59]. The protocol consists in voltage steps ranging between -110 mV and +110 mV with 20 mV increments. The holding potential is Vh = −70 mV, and the step duration is 100 ms. B) AWCON steady-state I-V relation. Comparison between experimental (red, data from [59]) and simulated (black) steady-state I-V curves. The simulated I-V curve is computed by averaging the currents in the last 5 ms of each voltage step, as in [59]. C) Current clamp simulation of the AWCON neuron. No published current clamp experimental data were found for AWCON. The in silico neuron shows active behavior when the injected current is above 6 pA (S6 Fig). The voltage response is characterized by an upstroke with a duration of ∼30 ms for Iext > 15 pA, followed by a plateau phase. The plateau height increases linearly with the stimulus amplitude (S6 Fig). A sensitivity analysis performed by varying the calcium removal rate τCa (Eq 28 and S6 Fig) do not show significant changes in the results. Current clamp stimulation protocol consists in 6 current steps ranging from -4 to 20 pA, with a duration of 500 ms. The holding current is Ih = 0 pA. The cell capacitance is 3.1 pF [59], that corresponds to 1.3μF/cm2 when scaled on the entire cell surface (Scell = 238.16μm2,from Neuromorpho.org). This value is in agreement with specific membrane capacitance reported for ASER [57], and with the one calculated for AIY by considering its total capacitance (∼0.7 pF [78]) and surface (65.89 μm2, from Neuromorpho.org).

