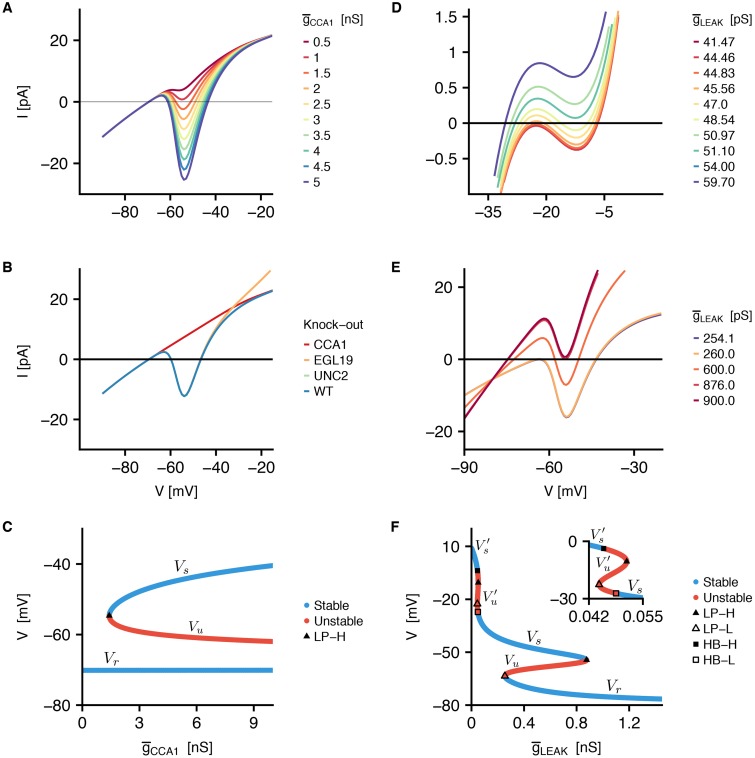
Fig 10. Analysis of the bistable behavior of RMD neuron.
A) Steady-state I-V curves at varying . Steady-state I-V curves are obtained from the currents computed during a voltage clamp stimulation with steps ranging between -90 mV and -10 mV, with 1 mV increments. The value of is varied between 0.5 nS and 5 nS with 0.5 nS increments. B) Calcium channels knockouts steady-state I-V curves. Voltage clamp simulation follows the same protocol of panel A. Knockout I-V curves are computed by removing the contribution of one of the CaV from the total current, leaving unchanged the other conductances. C) Bifurcation diagram with as bifurcation parameter. The black empty triangle represents the saddle-node (or limit point LP-H) bifurcation point [V, ] = [-59.5 mV, 1.14 nS]. At the system exhibits three fixed points: two stable (Vr and Vs) and one unstable (Vu). D)-E) Steady-state I-V curves for different values of . The passive conductance is varied between 0.04 nS and 0.9 nS to obtain the steady-state I-V curve in correspondence of the different regimes highlighted also by the bifurcation diagram analysis (panel F). The applied voltage stimuli ranges from -90 mV to -30 mV with 0.8 mV increments, in panel D, and from -35 mV to +5 mV with 0.8 mV increments, in panel E. Step duration 1300 ms, holding potential Vh = −70 mV. F) Bifurcation diagram with as bifurcation parameter. For 0.25 nS two stable solutions are separated by an unstable one. These correspond to Vr, Vs and Vs in panel C. At lower values of , and by decreasing the parameter, two unstable solutions and arise from a LP bifurcation (LP-H), with . By decreasing the control parameter, gains stability through a subcritical Hopf bifurcation (HB-H), while at lower values of the control parameter, Vs loses stability through a second subcritical Hopf bifurcation (HB-L). Finally, by further lowering the parameter, and Vs collide in a second fold bifurcation (LP-L) and remains the only stable solution at even lower values of . A second bistable regime may occur in between the two Hopf bifurcations.

