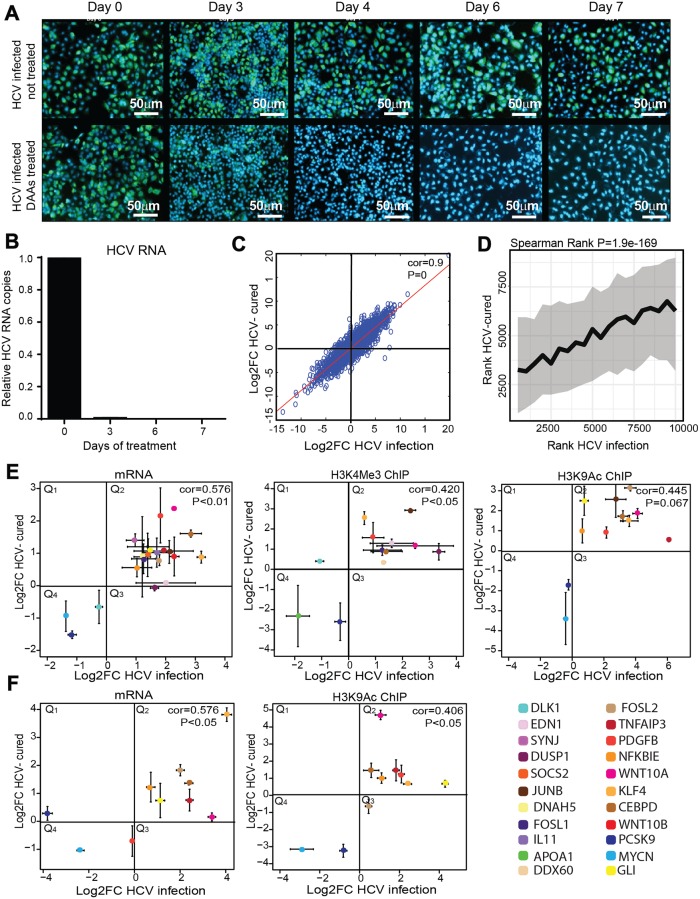
Fig 2. Epigenetic signature following cure of HCV by DAAs.
(A) Immunostaining to evaluate therapeutic potential of DAAs in HCV-infected cells. HCV-infected Huh7.5 cells, treated or not treated with DAAs were stained with HCV-positive serum and anti-human 488 Alexa fluor as secondary antibody to follow the eradication of HCV infection following treatment. Infection was visualized by fluorescence microscopy. Scale bars: 50μm. (B) The therapeutic potential of DAAs in HCV infected cells was evaluated by qRT-PCR. Levels of HCV RNA in the cells were quantified by qRT-PCR using primers for the HCV RNA 3’ UTR. Relative HCV RNA copies are calculated for Huh7.5 cured cells compared to non-infected Huh7.5 cells (also treated with DAAs) per ng of total cellular RNA. Differential expression was calculated using the equation of 2(-ΔΔCt), with the GAPDH as an endogenous control. Means mRNA levels of HCV are shown ± SD from three independent experiments. (C) Scatter plot of RNA level in HCV-cured cells (fold change was calculated compared to control cells) compared to HCV-infected cells (fold change was calculated compared to non-infected cells) and evaluated by qRT-PCR (Spearman Rank cor = 0.91, p = 0). Four biological replicates were performed. (D) Correlation between differential peaks in ChIP-seq of H3K9Ac in HCV-cured cells (compared to control cells) and HCV-infected cells (compared to non-infected cells). Differential regions were identified using edgeR. Each of the experiments was filtered for the most significant 60000 loci by P value. These were matched between the two experiments leaving 10000 loci. These results were then ranked by the directional -log10(PValue), for each experiment. The X rank was broken into 20 consecutive bins. For each of these bins the median and interquartile range of the matched ranks in Y were calculated and plotted (Spearman rank: p = 1.9e-169). Plots demonstrate an average of three to five biological replicates for each ChIP-seq. (E) Scatter plot of RNA level for specific genes in Huh7.5-cured cells (fold change was calculated compared to DAAs treated control cells) compared to HCV-infected cells (fold change was calculated compared to non-infected cells) and evaluated by qRT-PCR. Differential expression was calculated using the equation of 2(-ΔΔCt), with the GAPDH as an endogenous control. ChIP for H3K4Me3 and H3K9Ac histone modifications were performed in HCV-cured cells (fold change was calculated compared to DAAs treated control cells) compared to HCV infected cells (fold change was calculated compared to non-infected cells). The IP DNA level was quantified by qPCR with primers for specific genes. Values were normalized relative to qPCR for these genes following ChIP with normal Rabbit IgG Ab as control. Values are presented in scatter plots representing average ± SD from three biological replicates. Correlations calculated by Spearman rank and p-values are presented. (F) Scatter plot of RNA and H3K9Ac histone modification levels in specific genes in cured Huh7.5-HS cells compared to HCV infected Huh7.5-HS cells performed as described above. Values are presented in scatter plots representing average ± SD from Three biological replicates. Correlations calculated by Spearman rank and p-values are presented.

