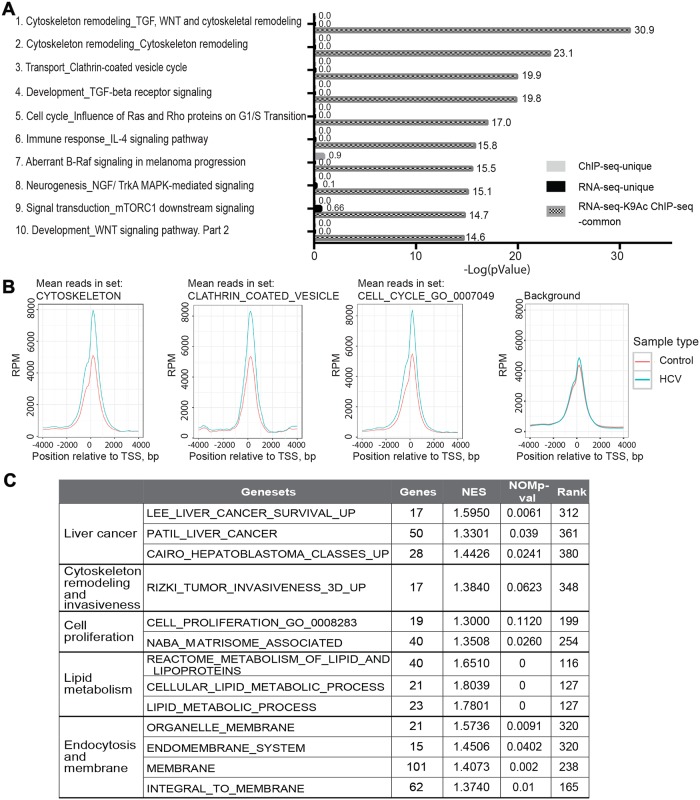
Fig 3. Pathway analysis generated from RNA-seq and H3K9Ac ChIP-seq integration data.
(A) Pathway analysis was generated by using both the RNA-seq and H3K9Ac ChIP-seq data. Enrichment analysis consisted of matching gene IDs of possible targets for the "common”(common to the RNA-seq and H3K9Ac ChIP-seq data) and "unique" (unique to the RNA-seq or H3K9Ac ChIP-seq data) sets, with gene IDs in functional ontologies in MetaCore. The probability of a random intersection between a set of IDs the size of the target list with ontology entities is estimated by the p-value of the hypergeometric intersection. Data were generated using the Thompson Reuter MetaCore analysis GeneGo. The most significant pathway maps that are common to both the RNA-seq and H3K9Ac ChIP-seq data are shown. The Log10 of the p-value is presented. (B) Profiles of the combined H3K9Ac Chip-seq data across the TSS regions of genes belonging to the indicated GO gene sets, and a control background generated by ranking all genes by read depth and randomly selecting control genes within 20 rank positions of each gene in the primary gene sets. Each line represents a triplicate. RPM, reads per million. (C) GSEA generated from H3K9Ac ChIP-seq data. A ranked gene list was generated for the differential H3K9Ac ChIP-seq data according to the p value. This ranked list was used for Gene Set Enrichment Analysis (http://software.broadinstitute.org/gsea/index.jsp).

