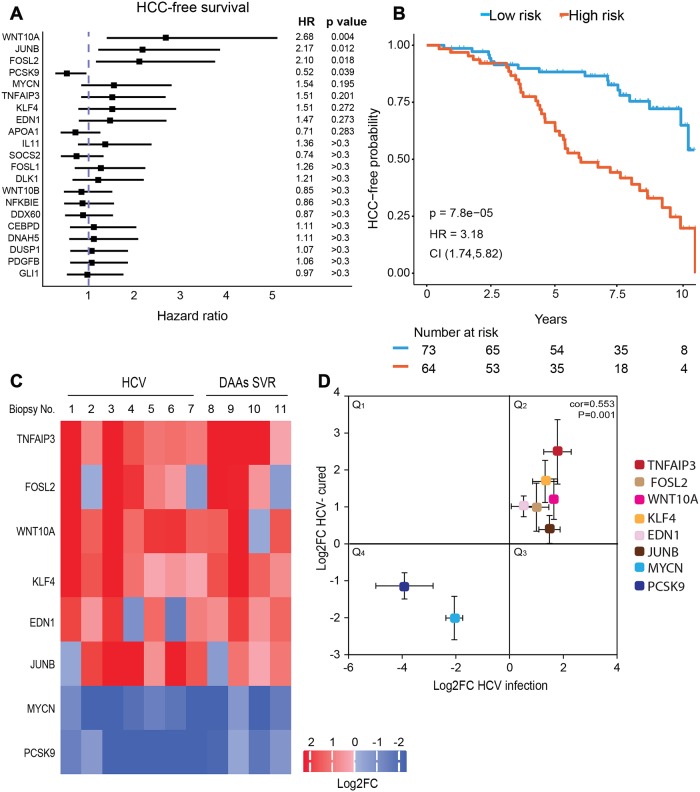
Fig 4. Epigenetic signature in human liver biopsies following cure of HCV infection.
(A) Forest plot of hazard ratios (HR) for HCC development among hepatitis C-related early stage cirrhosis samples [30], stratified according to the median gene expression levels. P-values were calculated using log-rank test. Genes are ordered from lowest to highest p-values. The HR, 95% confidence intervals (CI) and p-values are shown. (B) HCC-free survival according to the level of expression of the 8-gene signature (WNT10A, JUNB, FOSL2, MYCN, TNFAIP3, KLF4, EDN1, PCSK9). P-values were calculated using log-rank test. The HR and 95% CI are shown. (C and D) H3K9Ac ChIP was performed on liver biopsies (clinical data is described in S4 Table). The level of H3K9Ac for specific genes was quantified by qPCR, and values were normalized to ChIP with normal Rabbit IgG Ab only. These levels were quantified in 7 HCV-infected biopsies (No. 1–7) and 4 SVR biopsies (No. 8–11) and compared to the average level of the 6 control biopsies (No. 12–17). (C) Values of Log2FC for H3K9Ac ChIP-qPCR for each sample and each gene versus control are presented as a heatmap. (D) A scatter plot showing for each gene the Log2FC average values for H3K9Ac ChIP-qPCR for the HCV-infected biopsies (No. 1–7) versus the Log2FC H3K9Ac ChIP-qPCR average values for the SVR biopsies (No. 8–11). Correlation was calculated by Spearman rank (cor = 0.553, p = 0.001).

