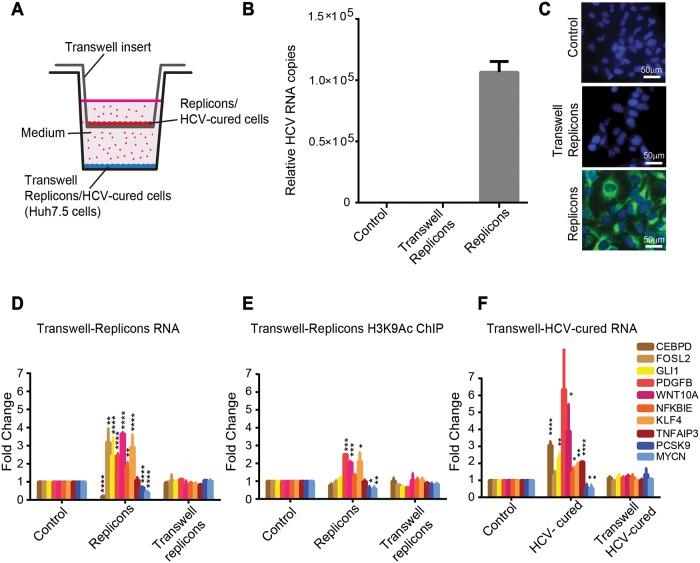
Fig 5. HCV-induced epigenetic alterations require the presence of HCV RNA or/and the expression of viral proteins in the cells.
(A) Huh7.5 cells were seeded in a 12 well plate. Inserts were placed on top of the wells in the plate and replicon cells were seeded in the upper compartments of the Transwell inserts. Cells were incubated for 7 days with free diffusion of the medium through the insert’s pores. Then, the RNA from cells in both upper and lower compartments was extracted and qPCR was performed for the tested genes. (B) Levels of HCV RNA were quantified by qRT-PCR using primers for the HCV RNA 3’ UTR in replicon cells, compared to transwell replicon and control cells. Relative HCV RNA copies are calculated for replicon cells compared to control cells per ng of total cellular RNA. Differential expression was calculated using the equation of 2(-ΔΔCt), with the GAPDH as an endogenous control. Means mRNA levels of HCV are shown ± SD from three independent experiments. (C) Immunostaining to validate expression of HCV proteins in replicon cells. Replicon cells or transwell replicon cells or control cells were stained with HCV-positive serum and anti-human 488 Alexa fluor as secondary antibody and visualized by fluorescence microscopy. Scale bars: 50μm. (D) The relative quantity of mRNA in replicon cells in the upper compartment, or Huh7.5 cells in the lower compartment (transwell replicon cells) was calculated compared to Huh7.5 control cells as quantified by qRT-PCR with primers specific for the tested genes. Differential expression was calculated using the equation of 2(-ΔΔCt), with the GAPDH as an endogenous control. Means fold change of mRNA levels (calculated compared to Huh7.5 control cells) are shown ± SD from three independent experiments. (E) Fold change values for H3K9Ac ChIP from replicon cells in both compartments. The IP DNA level was quantified by qPCR with primers for specific genes. Values were normalized relative to qPCR for these genes following ChIP with normal Rabbit IgG Ab as control. Values representing average ± SD from three biological replicates. (F) The Transwell assay was repeated as above but with HCV-cured cells seeded at the upper compartment of the Transwell inserts. Means fold change of mRNA levels (calculated compared to Huh7.5 control cells) are shown ± SD from three independent experiments (*p<0.05, **p<0.01, ***p<0.001, ****p<0.0001, t-test).

