Fig. 4.
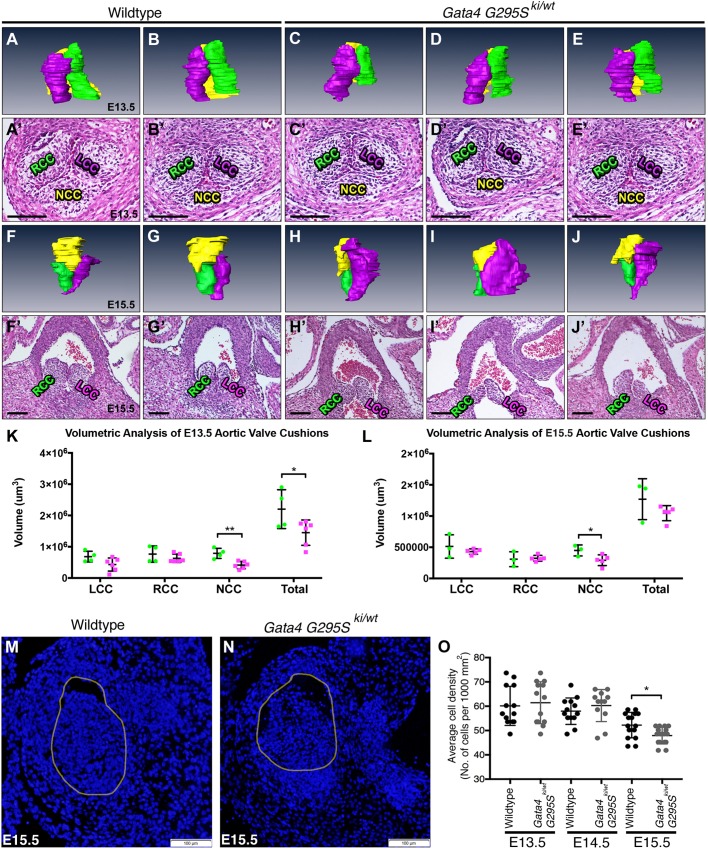
Gata4G295Ski/wt embryos display abnormalities during aortic valve cushion remodeling. (A-E′) 3D reconstructed images of aortic cushions from histological sections of E13.5 Gata4G295Ski/wt (C′-E′) and wild-type littermate (A′,B′) embryos. Gata4G295Ski/wt reconstructed E13.5 valves (C-E) display smaller NCC (yellow) compared with wild-type littermates (A,B). (F-J) 3D reconstructed images of the aortic leaflets from histological sections of E15.5 Gata4G295Ski/wt (H′-J′) and wild-type littermates (F′,G′). Gata4G295Ski/wt reconstructed E15.5 leaflets (H-J) display smaller NCC (yellow) and abnormally shaped RCC (green) and LCC (purple) compared with wild-type littermate controls (F,G). (K) Quantification of cushion volumes (green circles, wild type; purple squares, Gata4G295Ski/wt). (L) Quantification of leaflet volumes (green circles, wild type; purple squares, Gata4G295Ski/wt). For E13.5 3D reconstructions, wild type n=4, Gata4G295Ski/wt n=6, and for E15.5 reconstructions wild type n=3, Gata4G295Ski/wt n=5. (M-O) Nuclear DAPI staining demonstrates a reduced number of nuclei per unit area in the developing aortic valve of Gata4G295Ski/wt E15.5 embryos compared with wild-type littermates, but no difference was seen at E13.5 or E14.5. Yellow circle in M and N approximates aortic lumen in representative images that were used for quantification of aortic valve cells. Wild type n=3, Gata4G295Ski/wt n=3 for each timepoint in which multiple sections from each were used for quantification. *P≤0.05; **P≤0.005 (Student's t-test). Scale bars: 100 μm.

