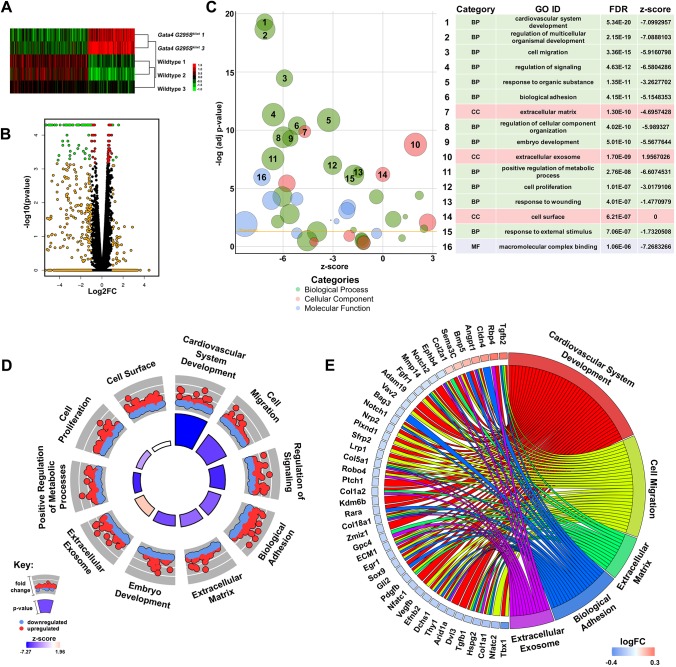
Fig. 6.
Gene expression differences identified in E15.5 Gata4G295Ski/wt OFT. (A) Heatmap demonstrating differential gene expression of 457 genes, with P-value≤0.05 and log fold change >1.25, between OFTs from E15.5 Gata4G295Ski/wt and wild-type littermates. The expression intensity is displayed as log-2-transformed and plotted on a red (upregulated) to green (downregulated) scale. (B) Volcano plot demonstrating the differential gene expression of the Gata4G295Ski/wt OFTs compared with control (red, P-value≤0.05; orange, expression change ≥1.5-fold; green, P-value≤0.05 and a fold change ≥1.5-fold). (C) Top 100 enriched GO terms, depicted as a bubble plot, with the top 16 terms labeled [green, biological process (BP); red: cellular component (CC); blue, molecular function (MF)]. (D) Circle plot highlighting ten of the top 16 GO terms. Red dots, genes within the pathway that are upregulated; blue dots, genes that are downregulated. The height of the inner circle section is associated with P-value (taller, more significant) and the color of the inner circle is associated with z-score (blue, downregulated; red, upregulated). (E) Chord plot representing 45 differentially expressed genes linked to the associated GO term(s). The logFC is represented on a scale of blue (downregulated) to red (upregulated).

