Fig. 7.
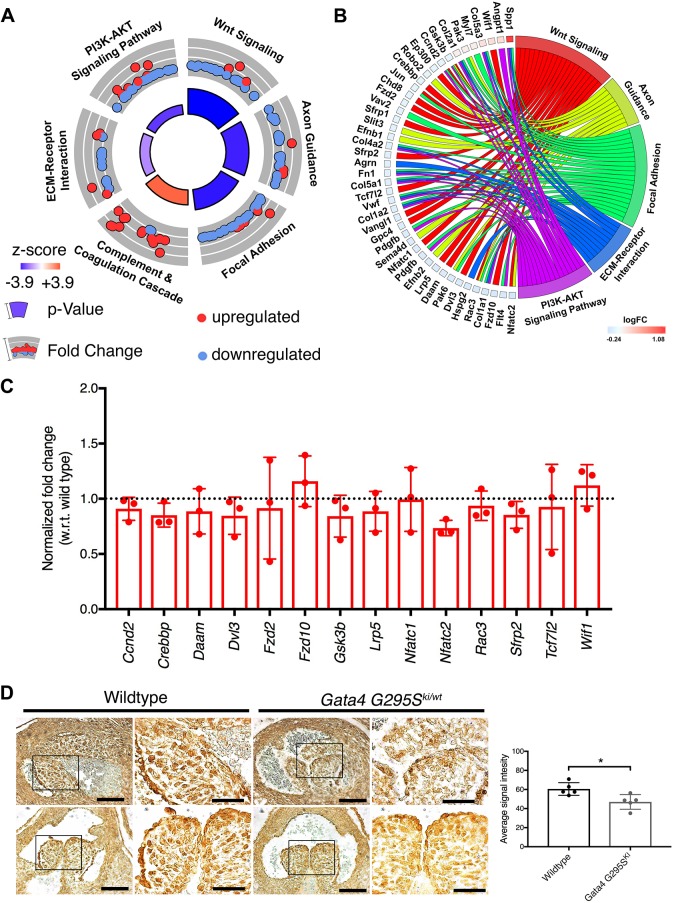
Dysregulation of the Wnt signaling pathway identified in the E15.5 Gata4G295Ski/wt OFT. (A) KEGG Pathway analysis identified changes in key heart development pathways, which are represented as a circle plot and includes the most enriched pathway, Wnt signaling. Red dots, genes within the pathway that are upregulated; blue dots, genes that are downregulated. The size of the inner circle section is associated with P-value (taller, more significant) and the color of the inner circle is associated with z-score (blue, downregulated; red, upregulated). (B) Chord plot highlighting 40 differentially expressed genes linked to the associated KEGG pathway(s). The log fold change (logFC) is represented on a scale of blue (downregulated) to red (upregulated). (C) Transcript levels of representative Wnt signaling pathway genes identified in RNA-seq quantified in three independent littermate samples of E15.5 Gata4G295Ski/wt OFTs by RT-qPCR when compared with wild-type littermate OFTs. All genes were normalized with respect to (w.r.t.) internal Gapdh control. Dotted line represents wild-type expression. (D) Immunohistochemistry for β-catenin protein in E15.5 aortic valve leaflets from Gata4G295Ski/wt and wild-type littermates. An overall decrease in β-catenin expression in the endothelial lining of the cushions, as well as a loss of punctate expression within the nuclei of the interstitial cells, is noted in Gata4G295Ski/wt when compared with the littermate control. Representative images from two mutant and two wild-type (littermate) embryos are shown (right column for each genotype is magnification of boxed area in left column). Graph shows quantification of positive staining using ImageJ (n=5). *P≤0.05 (Student's t-test). Scale bars: 80 μm (left); 40 μm (magnifications, right).

