Fig. 4.
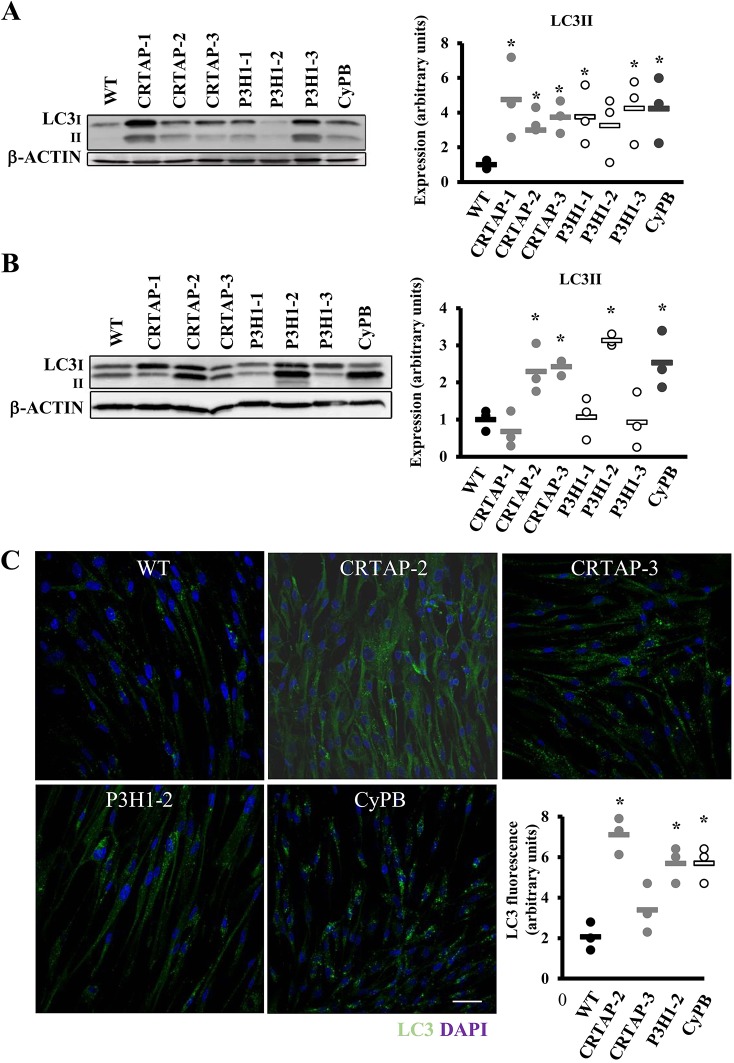
Recessive OI cells react to cellular stress by activating autophagy. (A) Representative western blot (left) and dot plot of the quantitative analysis (right) of the terminal autophagic marker LC3 in control (WT) and in cells with mutations in CRTAP, P3H1 or CyPB. LC3-II is upregulated in all cases except in patient P3H1-2. β-actin was used for normalization. (B) Representative LC3 western blot (left) performed on cell lysates obtained following chloroquine incubation from WT and mutant samples, and dot plot of the quantitative analysis (right). The terminal marker of autophagy evaluated in dynamic conditions is increased in CRTAP-2, CRTAP-3, P3H1-2 and CyPB. β-actin was used for normalization. (C) Representative LC3 immunofluorescence images of WT and mutant fibroblasts treated with chloroquine. Quantitation of the total area of punctate signal per cell confirms the activation of autophagy. DAPI (nuclei) in blue and LC3 in green. Magnification 40×, zoom 4×. WT values are represented as black dots; CRTAP as gray dots; P3H1 as white dots; CyPB as dark gray dots. *P<0.05. Scale bar: 40 µm.

