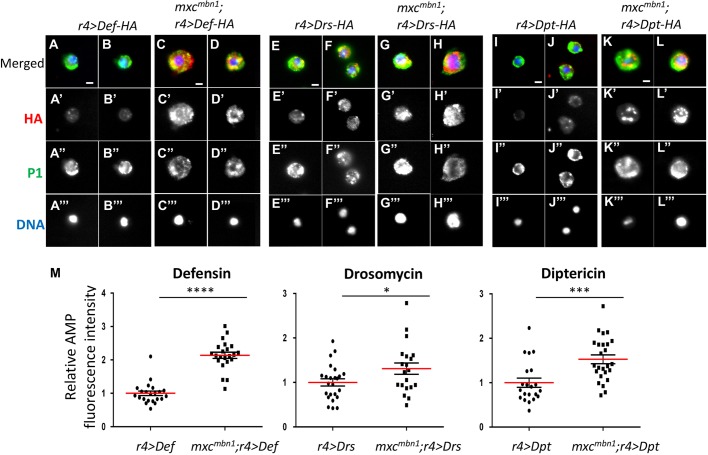
Fig. 9.
Accumulation of AMPs in circulating haemocytes from normal control and mxcmbn1 larvae overexpressing AMPs in their fat bodies. (A-L‴) The cellular localisation of AMPs fused with a HA-tag in circulating haemocytes immunostained with anti-P1 antibody. Two typical examples of the haemocytes are shown for each genotype. (A-D) Circulating haemocytes from larvae overexpressing HA-tagged Def in their fat bodies, control (r4>Def) (A,B) and mxcmbn1/Y; r4>Def (C,D). (E-H) Circulating haemocytes from larvae overexpressing HA-tagged Drs in their fat bodies, control larvae (r4>Drs) (E,F) and mxcmbn1/Y; r4>Drs (G,H). (I-L) Circulating haemocytes from larvae overexpressing HA-tagged Dpt in their fat bodies, control (r4>Dpt) (I,J) and mxcmbn1/Y; r4>Dpt (K,L). Red, anti-HA immunostaining to recognise each AMP; green, anti-P1 immunostaining to recognise circulation plasmatocytes; blue, DAPI staining. (M) Quantification of the fluorescence intensity of anti-HA immunostaining images from larvae overexpressing Defensin, Drosomycin and Diptericin. Student's t-test, *P<0.05, ***P<0.001, ****P<0.0001. The error bars represent s.e.m. The horizontal red lines represent the mean. Scale bars: 10 μm.

