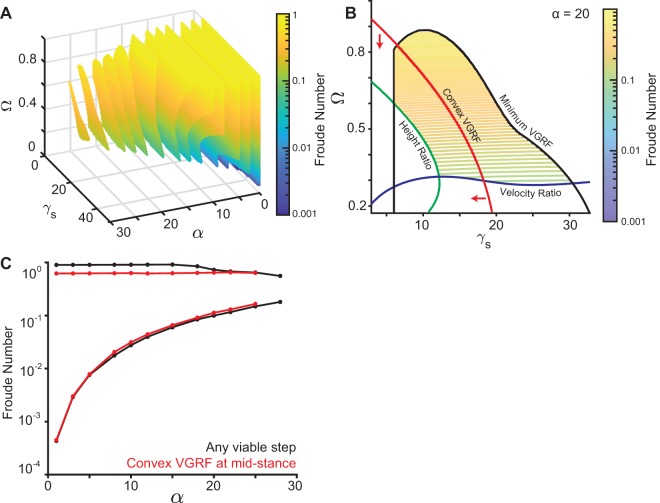
Fig. 2.
Non-dimensional analysis of SLIP model. (A) A sequence of 2D slices each corresponding to one value of α. The colored area is allowed under the constraints described in Fig. 1D. Colors represent the Froude number. The vertical mid-stance height r˳ is fixed at 0.95. (B) 2D contour plot of the α = 20 degree slice for r˳ = 0.95 as in A. Black represents the VGRF criterion boundary, blue the velocity criterion boundary, and green the height criterion boundary. The red line separates the concave and the convex VGRF regions, with the convex region (mid-stance minimum) denoted by the red arrows. (C) Range of Froude number supported under the constraints in Fig. 1D. The red line represents additionally meeting the convex VGRF criterion. For each α, γs and Ω were varied to obtain the slowest and fastest steps. r˳ was fixed to 0.95 like in A.

