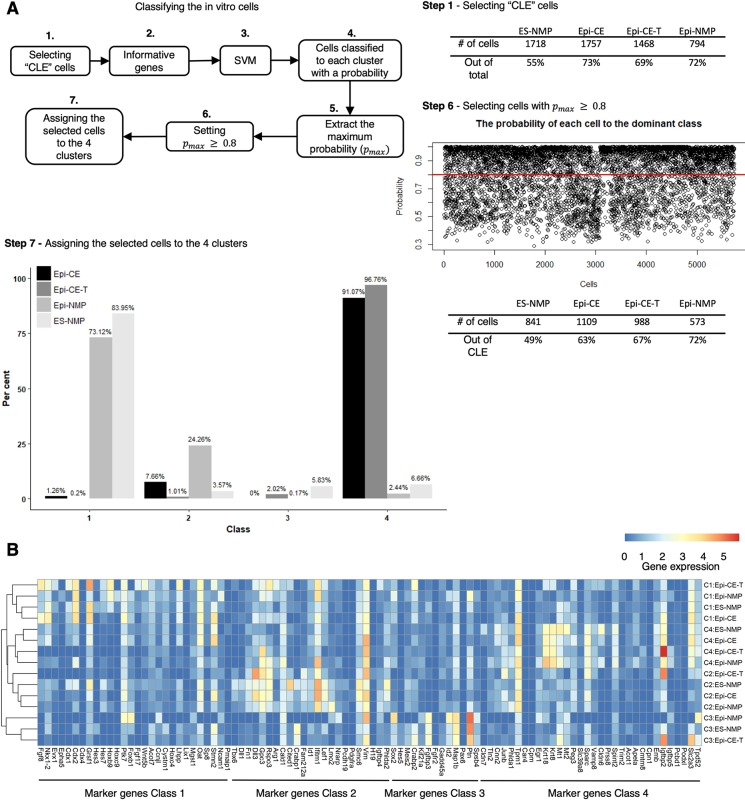
Fig. 4.
Classifying the in vitro cells using the SVM trained on the embryo data. (A) Workflow of the classification of the in vitro cells (for details see text and Materials and Methods). (B) Average expression of the 96 marker genes found in the embryo in the in vitro samples classified to the four classes. Rows of the expression heatmap are hierarchy clustered. Blue-red colour bar indicates the gene expression.

