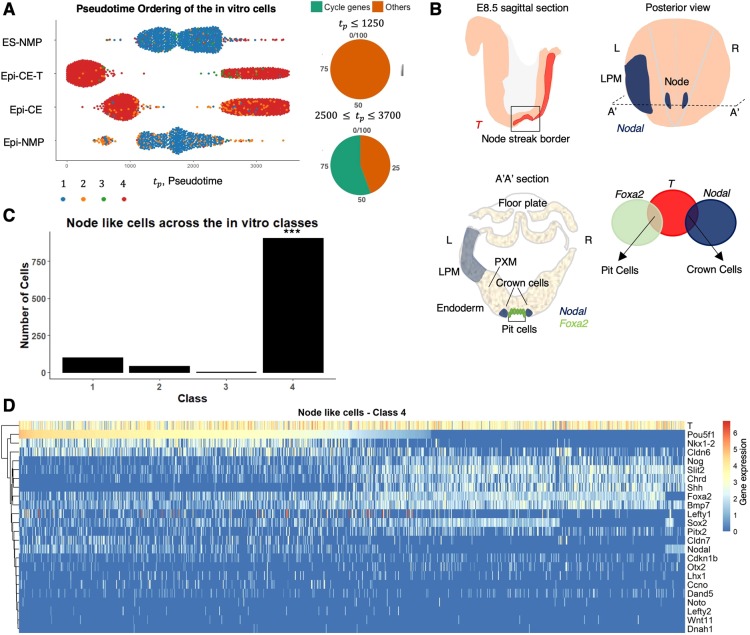
Fig. 5.
Class 4 contains node-like cells. (A) Pseudotemporal order of the in vitro cells that were classified to the four classes. Class 4 is divided to two pseudotime ranges: the later range of highly expressed genes contains 55% of cycling genes, whereas the early range does not contain any cycling genes (Materials and Methods). (B) E8.5 mouse embryo node: illustration of a sagittal view of the embryo shows the expression of T (red) in the NSB (Tsakiridis et al., 2014). Posterior view of the embryo exhibits the expression of Nodal (blue) in the node and in the LPM (Shiratori and Hamada, 2006) and its left (L) right (R) asymmetry. A transverse section (A′A′) reveals the pit and crown cells of the node, PXM, LPM, endoderm and the prospective floor plate. The expression of Nodal and Foxa2 is indicated in blue and green, respectively. The pit cells co-express T and Foxa2 and the crown cells express Nodal and T (Davidson and Tam, 2000; Jeong and Epstein, 2003; Lee and Anderson, 2008; Shiratori and Hamada, 2006). (C) The distribution of the node-like cells among the four classes: a significantly higher number of the node-like cells are found in class 4 in comparison with the other classes. ***P<0.001 (calculated empirical P-value; see Materials and Methods for details). (D) Gene expression heatmap of chosen node genes in class 4. The genes are hierarchically clustered and the cells are ordered in accordance with the decreasing expression of Oct4 (Pou5f1). Gene expression, which is defined as log2(CPM+1) (Materials and Methods), is indicated by the blue-red colour bar.

