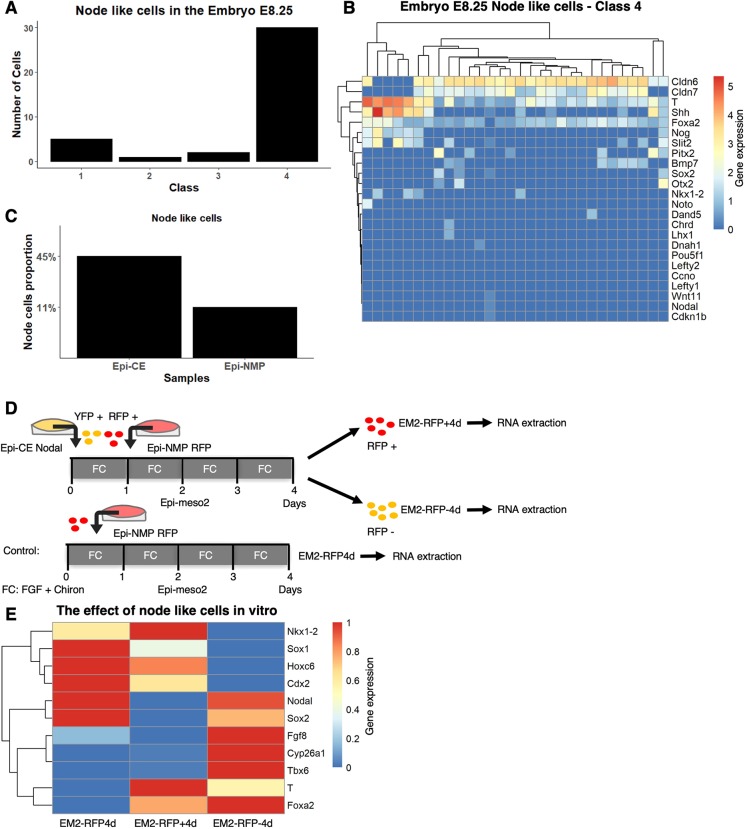
Fig. 6.
Node cells are needed to maintain the NMPs. (A) Distribution of the node cells among the four classes in the embryo. (B) Expression of chosen node genes in the embryo class 4. Genes and cells are hierarchically clustered. Gene expression, which is defined as log2(CPM+1), is indicated by the blue-red colour bar. (C) Proportion of node-like cells in the Epi-CE and Epi-NMP samples. (D) YFP-positive cells of Epi-CE Nodal sample composed of Nodal::YFP cells and RFP-positive cells of Epi-NMP RFP sample composed of Ubiquitin::Tomato cells were used to make Epi-meso2 mixture (Materials and Methods). This mixture was grown for 4 days then the cells were sorted based on their RFP fluorescence: RFP-positive cells (EM2-RFP+4d) and RFP-negative cells (EM2-RFP-4d). EM2-RFP4d is the control. The sorted cells and the control sample were quantified for their mRNA of a chosen set of genes using RT-qPCR. (E) Expression heatmap of 11 genes, obtained using RT-qPCR, in cells grown in the three conditions indicated in Fig. 6D. The normalized expression of each gene to the housekeeping gene Ppia was scaled between 0 and 1 across the different conditions. Gene expression is indicated by the blue-red colour bar.

