Fig. 1.
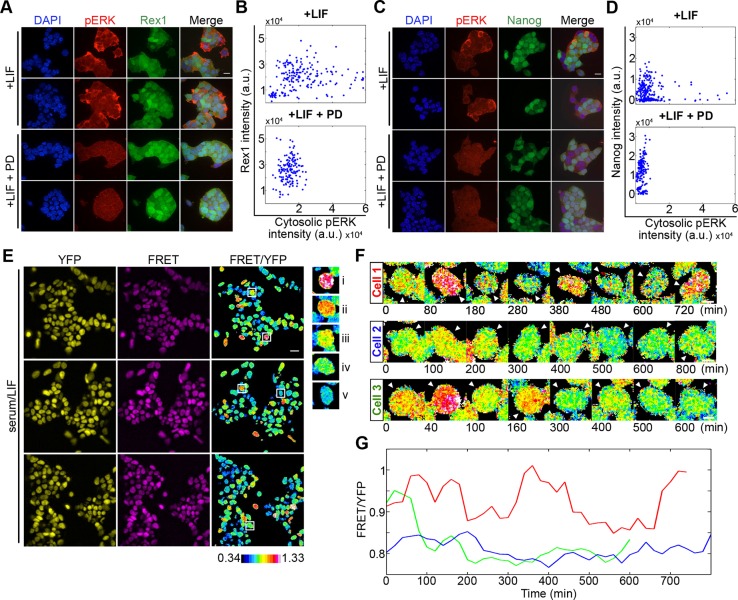
Monitoring ERK activity dynamics in single live ESCs. (A) Immunofluorescence of Rex1-GFP reporter ESCs immunostained for pERK (red) and DAPI (blue), cultured in serum+LIF alone or additionally treated with MEK inhibitor PD0325901 (PD; 1 μM) 3 h before fixation. (B) Rex1 reporter intensity plotted against cytosolic pERK levels in serum/LIF (+LIF; r=0.1652, P=0.0220, n=192) and PD (+LIF+PD; r=0.1509, P=0.0681, n=147). (C) Immunofluorescence of Nanog-GFP reporter ESCs immunostained for pERK (red) under the same culture treatments as in A. (D) Nanog reporter intensity plotted against cytosolic pERK level for ESCs in serum/LIF (+LIF; r=−0.089, P=0.1498, n=266 cells) and PD (+LIF+PD; r=0.26, P=0.0005, n=180 cells). Representative experiments from two and three biological replicates for Rex1 and Nanog, respectively, are shown in A-D. (E) ESCs stably expressing the ERK FRET reporter, EKAREV-NLS, cultured in serum/LIF. YFP and FRET channel images shown for three fields of view with the corresponding FRET/YFP ratio image. Examples of cells displaying distinct FRET ratio levels are outlined and shown in the right panel, in order of descending FRET (i-v). Colour key represents the measured FRET/YFP ratios of cells. (F) FRET/YFP ratio filmstrips of individual ESCs in serum/LIF. (G) Changing FRET/YFP levels of the cells shown in F. Red, cell 1; blue, cell 2; green, cell 3. Scale bars: 25 µm (A,C); 20 µm (E); 5 µm (F).

