Fig. 5.
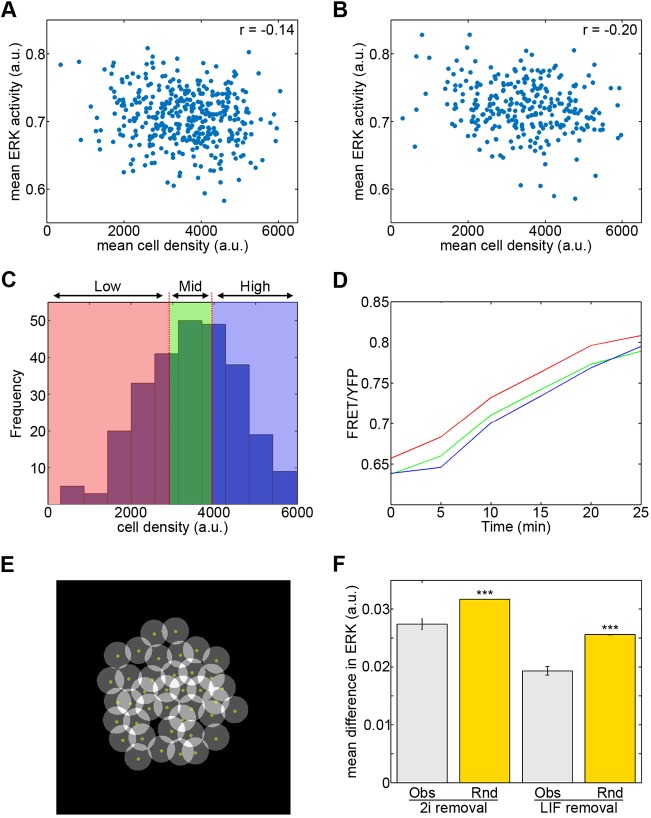
Spatial regulation of ERK activity dynamics during differentiation. (A) Mean cell density around each cell over 16 h differentiation (2i removal) plotted against mean ERK (one replicate shown; r=−0.14, P=0.0059, n=388). (B) Mean cell density versus mean ERK activity during the first 25 min of the time series (one replicate; r=−0.20, P=0.0013, n=261). (C) Histogram of average cell density values from the first 25 min for all cells in a single replicate. Colours show binning of cells into three equal groups of low (red), intermediate (green) and high (blue) density. (D) The initial increase in FRET/YFP ratios of cells grouped based on density (colour-coded as in C). Differences in FRET ratio values between high and low cell density group were significant (P=0.0044; see also Fig. S5B). (E) Identification of neighbouring cells. A circle of 25 pixel radius was fixed around the manually selected centroid (yellow dot) of each cell. Cells with overlapping circles were considered neighbours. (F) Mean difference in ERK activity between neighbours (Obs) and randomly assigned neighbours (Rnd). Data shown for differentiation following 2i removal (594 neighbours) and LIF removal (576 neighbours). Error bars represent s.e.m. Differences assessed using Mann–Whitney tests. ***P<0.001. All data are typical of three independent replicates.

