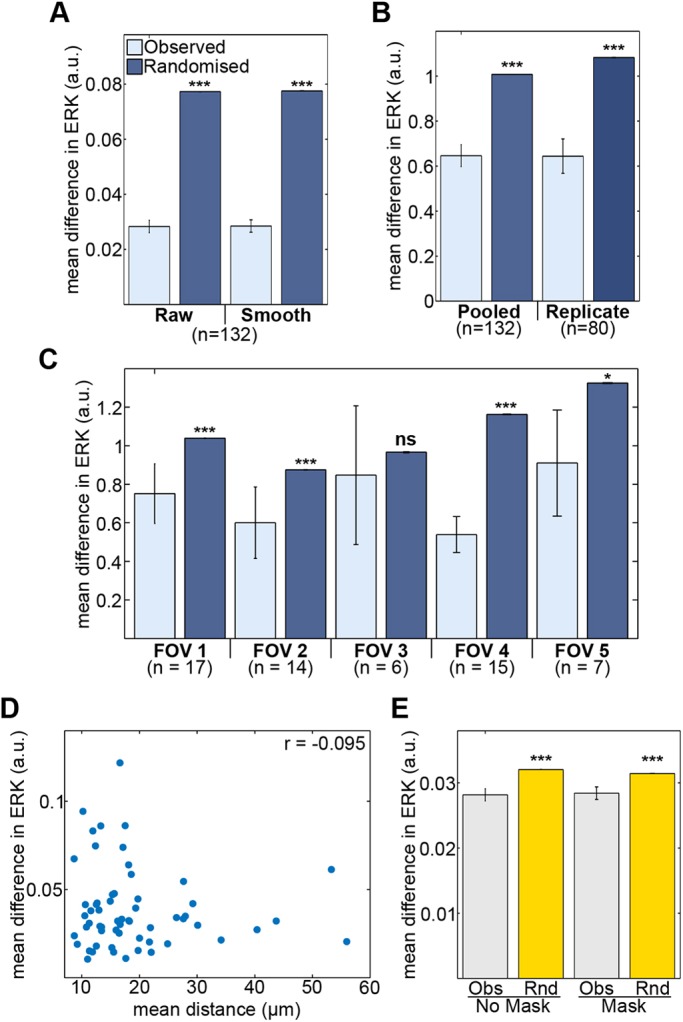
Fig. 6.

Stability of levels of ERK activity along cell lineages. (A) Daughter cells from a cell division have more similar ERK activity than randomly paired daughters. Analysis was carried out on both raw and filtered (smoothed) FRET traces of daughter cells pooled from three replicates. (B) Differences in mean ERK activity of real and randomised daughter pairs pooled from three replicates and from a single replicate following correction for time-associated differences in ERK activity. (C) Differences in corrected mean ERK activity of real (observed) and randomised daughters from each imaging field of a single replicate. Vertical axes report corrected FRET values from filtered (smoothed) traces. The n-values represent numbers of cell pairs analysed. (D) Scatter plot of mean distance and mean difference in ERK activity between daughter pairs (r=−0.095, P=0.47, n=59). (E) Masking related daughters from neighbour analysis does not alter the increased similarity in ERK activity between neighbouring cells (Obs) compared with non-neighbours (Rnd). Significance testing used Mann–Whitney tests. Error bars represent s.e.m.
