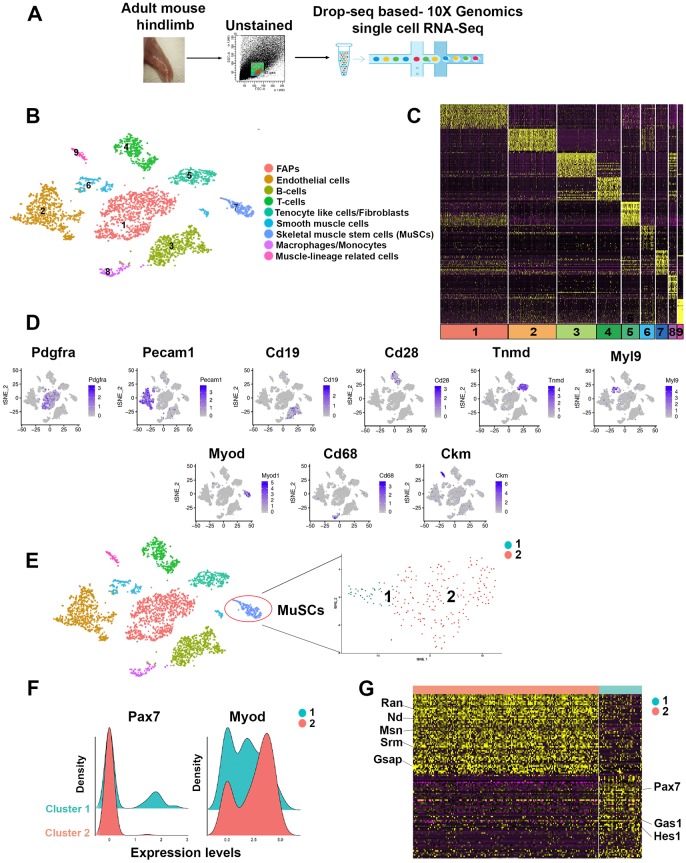
Fig. 1.
Identification of distinct cell populations in mouse adult skeletal muscle. (A) Scheme of muscle dissection, single cell FACS isolation and scRNA-seq. (B) Graph-based clustering of FACS-isolated single cells identifies distinct clusters corresponding to different cell populations. (C) Heatmap representing the top 20 most variably expressed genes between cell clusters identified. Colors and numbers correspond to the cell clusters shown in B. (D) Expression of representative genes in distinct cell clusters. (E) Clustering and t-SNE plot of freshly FACS-isolated single cells with MuSC characteristics. (F) Kernel density estimation of Pax7 and Myod transcripts in MuSC cluster 1 and cluster 2. (G) Heatmap representing the top 50 most variably expressed genes between the two MuSC clusters.

