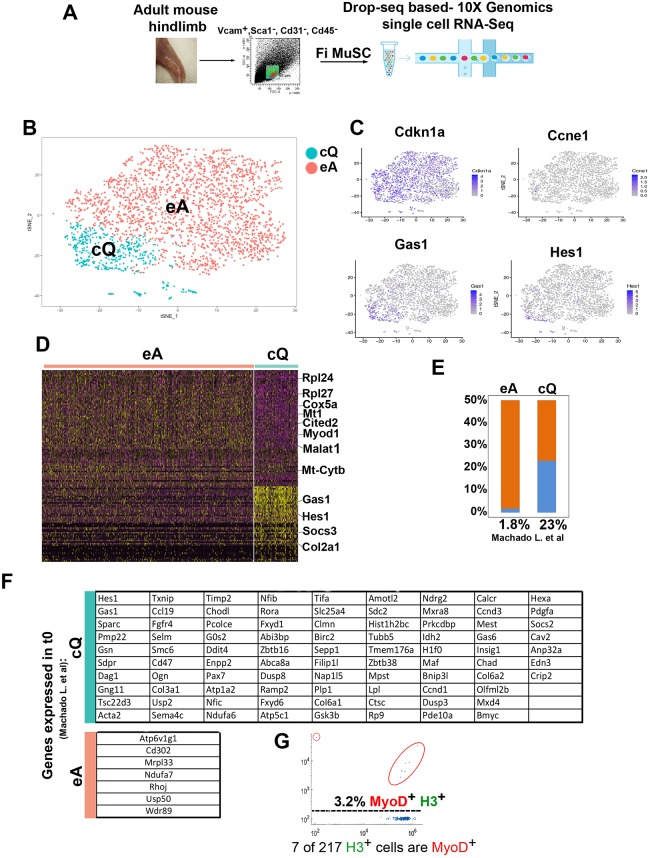
Fig. 2.
Transcriptional characterization of FACS-isolated MuSCs. (A) Scheme of MuSC FACS isolation and scRNA-seq. (B) Graph-based clustering of FACS-isolated MuSCs (VCAM1+/CD31−/CD45−/Sca1−) identifies two clusters: MuSCs close-to-quiescence (cQ) and MuSCs early activation (eA). (C) Expression pattern of the cell cycle inhibitor genes Cdkn1a, cyclin E (Ccne1), growth-arrest 1 (Gas1) and the Notch target Hes1. (D) Heatmap of the top 50 most variably expressed genes between MuSC cQ and MuSC eA. (E) Percentage of transcripts shared between MuSC eA, MuSC cQ and PFA-fixed t0 MuSCs (Machado et al., 2017). (F) Gene list of transcripts shared between MuSC eA, MuSC cQ and PFA-fixed t0 MuSCs (Machado et al., 2017). Prkcdbp, Cavin3; Sdpr, Cavin2; Selm, Selenom; Sepp1, Selenop. (G) Single cell western blot analysis of 217 freshly FACS-isolated MuSCs with histone H3 and MyoD antibodies. MyoD+ cells are encircled in red.

