Fig. 4.
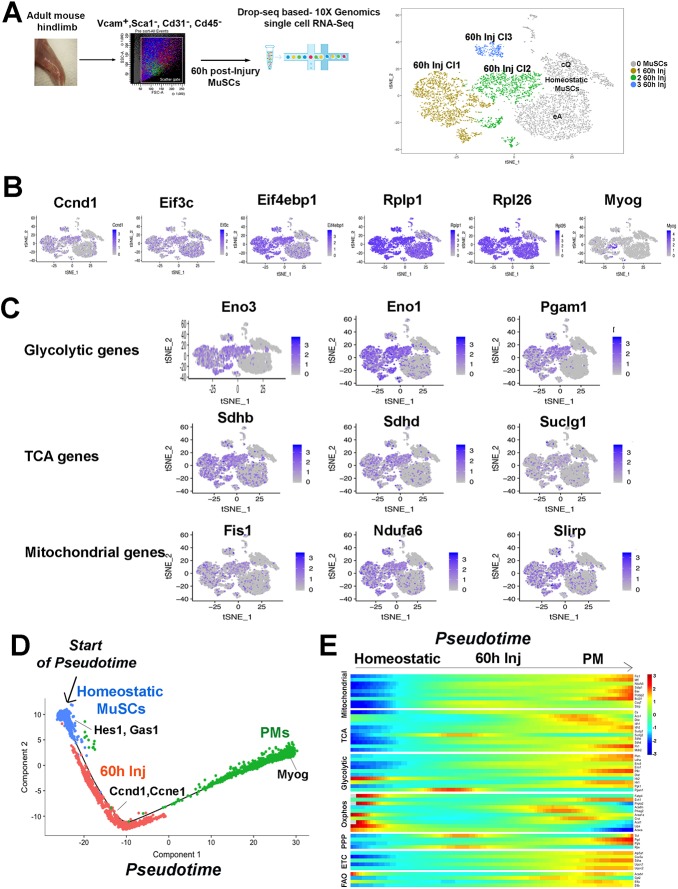
Clustering and single cell trajectories of homeostatic MuSCs, injured MuSCs, and PMs. (A) Scheme of MuSC FACS isolation 60 h after muscle injury, scRNA-seq, and graph-based clustering of FACS-isolated homeostatic and MuSCs 60 h after injury. Homeostatic MuSCs (in gray) are composed of two clusters, cQ and eA, and MuSCs 60 h of three clusters, 60 h Cl1, Cl2 and Cl3. (B) Expression pattern for Ccnd1, translation initiation factors (Eif3c, Eif4ebp1), ribosomal genes (Rplp1, Rpl26), and myogenin (Myog). (C) Expression pattern of glycolytic, TCA and mitochondrial genes. (D) Pseudotime single cell trajectory reconstructed by Monocle2 for homeostatic MuSCs, injured MuSCs (60 h Inj) and PMs. Transcripts enriched in distinct cell states are indicated. (E) Pseudotemporal heatmap showing gene expression dynamics for metabolic genes. Genes (row) are clustered and cells (column) are ordered according to pseudotime.

