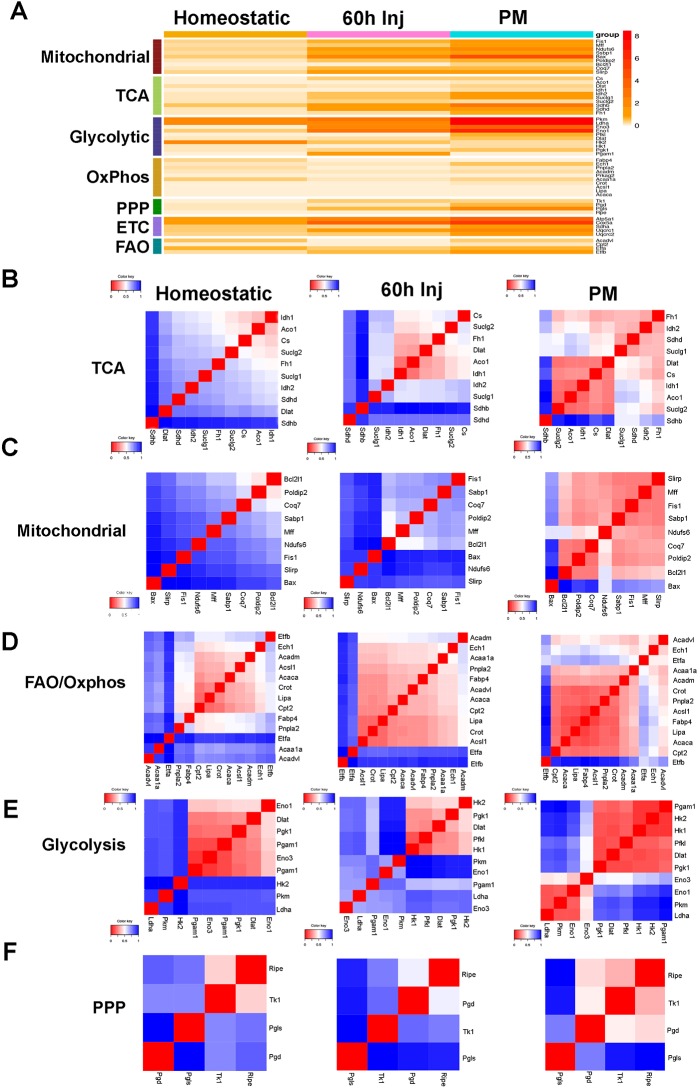
Fig. 5.
Metabolic pathways gene connectivity in homeostatic MuSCs, injured MuSCs, and proliferating myoblasts. (A) Heatmap of average expression for metabolic genes in homeostatic and injured MuSCs (60 h Inj), and in PMs. (B-F) Distance matrices indicating gene connectivity (highest connectivity, red; lowest connectivity, blue) of metabolic genes in homeostatic and injured MuSCs and in PMs.

