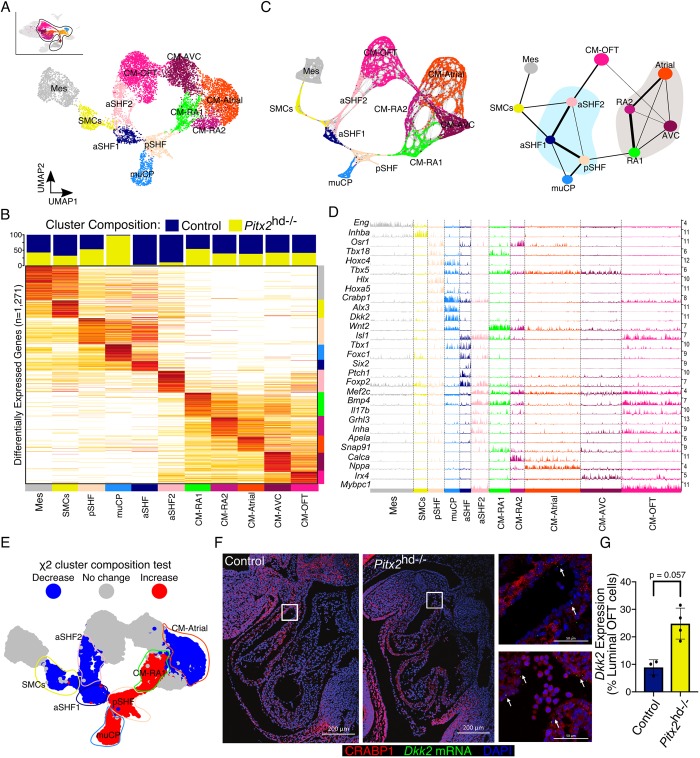
Fig. 2.
Pitx2-dependent cardiac cell composition at E10.5. (A) UMAP plot of subclustered E10.5 cells. (B) Cluster composition colored by genotype (top). Average gene expression heatmap showing iterative clustering results from Fig. 2A (bottom). Clusters are colored according to χ2 cluster composition analysis of E10.5 Pitx2 null cardiac tissue compared with control. (C) Force-directed graph of PAGA-initialized embedding derived from cells in Fig. 2A (left). PAGA graph showing the relationships between the subclusters (right). (D) Track plot showing gene expression (rows) for cells in highlighted clusters (columns). Track height represents gene expression. Numbers (right) indicate maximum detected expression. (E) χ2 cluster composition analysis of subclustered E10.5 Pitx2 null cardiac tissue compared with control. (F) CRABP1 IF (red) and Dkk2 FISH (green) of E10.5 embryos. Arrows indicate cells expressing Dkk2. Images on right are magnifications of the boxed areas in Control (top) and Pitx2 null (bottom) embryos. (G) Quantification of Fig. 2F. Data are mean±s.e.m. (Mann–Whitney U test). aSHF, anterior second heart field progenitors; CM-Atrial, atrial cardiomyocytes; CM-AVC, atrioventricular cardiomyocytes; CM-OFT, cardiomyocytes of outflow tract; CM-RA, right atrial cardiomyocytes; Mes, mesenchymal cells; muCP, progenitors enriched in Pitx2 null tissue; pSHF, posterior second heart field progenitors; SMCs, smooth muscle cells.

