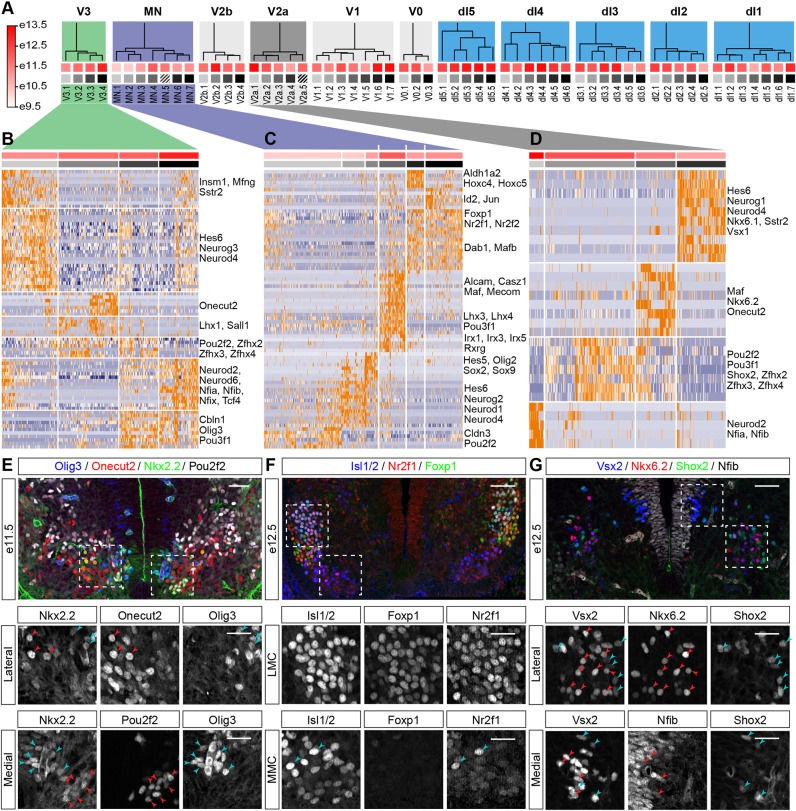
Fig. 4.
Hierarchical clustering identifies neuronal subtypes and implicates TFs in determining their identity. (A) Hierarchical clustering of the cardinal types of spinal cord neurons reveals 59 neuronal subtypes. Dendrograms for each neuronal domain are depicted. Squares under the dendrogram indicate average age (red) and neuronal subtype identity (grey). Colours of squares correspond to those shown on top of the heatmaps in panels B-D and Fig. S4. Striped squares correspond to incorrectly classified cells that were discarded from further analysis. (B-D) Identification of neuronal subtypes by clustering of gene expression profiles in V3 (B), MNs (C) and V2a interneurons (D). Hierarchical clustering was performed using the indicated gene modules (Table S2). A subset of the genes that are included in the modules is indicated on the right-hand side. (E-G) Validation of predicted gene expression patterns obtained from the hierarchical clustering in B-D. Boxed areas are magnified in the middle and bottom rows. Expression of Pou2f2 is detected in Nkx2.2-expressing V3 neurons at e11.5. Pou2f2 expression does not overlap with Onecut2 in more dorsal V3 neurons or Olig3 in V3 neurons abutting the p3 domain (E). Nr2f1 expression is seen in Foxp1-positive LMC neurons at e12.5 (F, middle row). A few Nr2f1-positive cells are also detected in Foxp1-negative MNs within the MMC (F, bottom row). Nkx6.2 expression in lateral Vsx2-expressing V2a neurons does not overlap Shox2 expression at e12.5 (G, middle row). Nfib expression is confined to medial V2a neurons at this stage (G, bottom row). Red arrowheads indicate cells expressing markers in the middle column; blue arrowheads indicate cells expressing markers in the right column. Scale bars: 50 µm; 25 µm in magnified boxed areas.

