Fig. 6.
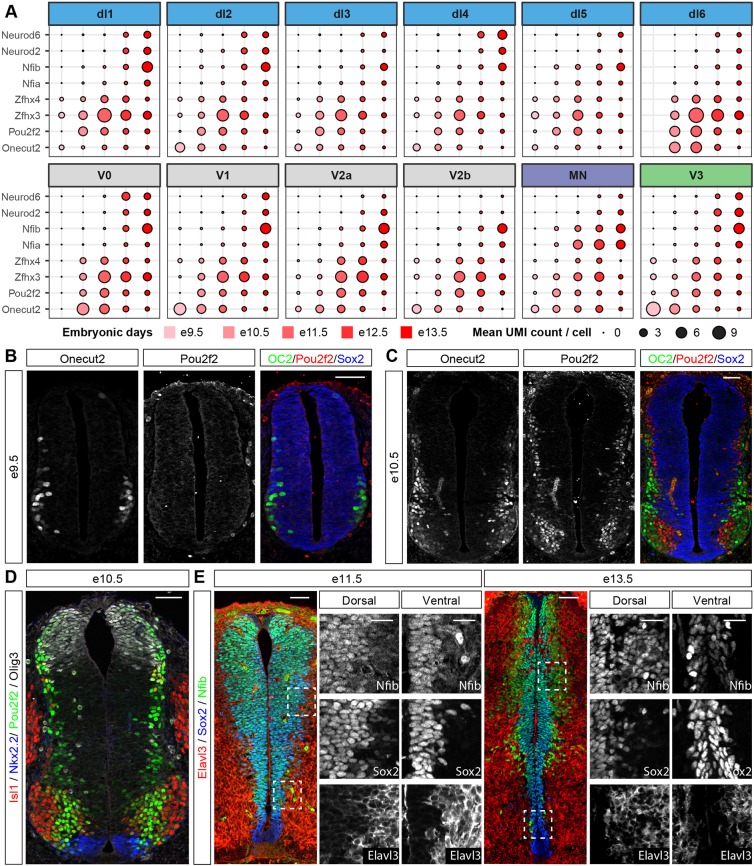
Temporal stratification of neuronal subtypes by shared sets of TFs. (A) Temporal expression of a shared set of TFs in different neuronal populations identifies two waves of neurogenesis. The size of the circles indicates the mean expression of genes per stage and domain, and the colour indicates the age of the sample. (B) Onecut2 (OC2), but not Pou2f2, is expressed in neurons at e9.5. (C) Mutually exclusive expression of Onecut2 and Pou2f2 in spinal cord neurons at e10.5. Note that Onecut2-expressing neurons are typically located more laterally than Pou2f2-positive neurons. (D) Widespread expression of Pou2f2 at e10.5 in differentiating neurons close to the ventricular zone. Pou2f2 expression colocalises with Olig3, Nkx2.2 and Isl1. (E) Increased expression of Nfib in differentiating neurons at late developmental stages. Boxed areas are magnified in the middle and right rows for each developmental stage. Nfib is expressed at low levels at e11.5 in progenitors that are labelled with Sox2 and is not detected in neurons. By contrast, at e13.5 Nfib expression is observed in neurons that also express the neuronal marker Elavl3. Scale bars: 50 µm; 25 µm in in magnified boxed areas.

