Fig. 6.
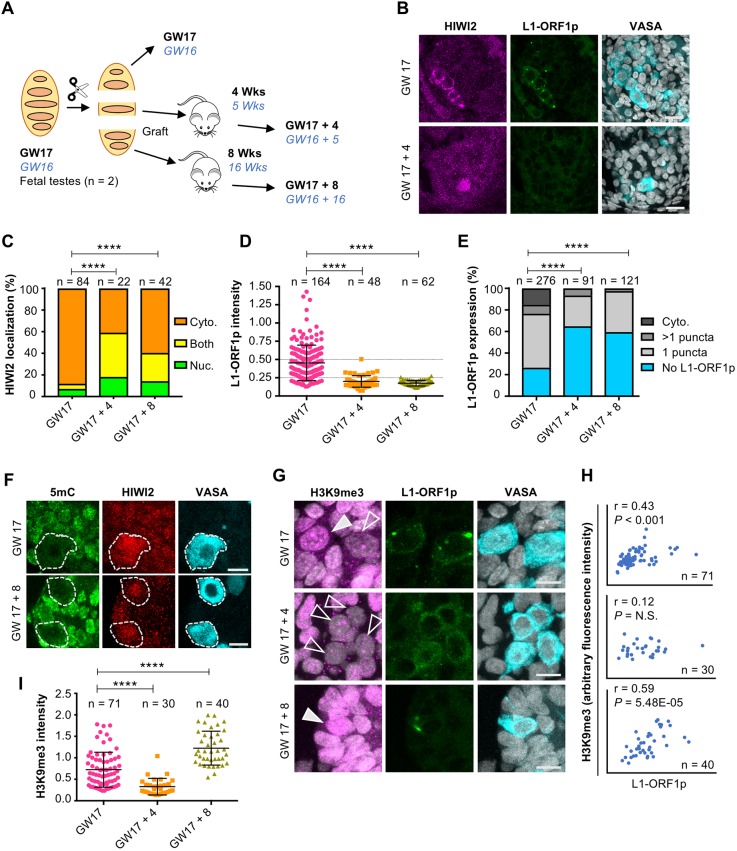
Evidence for PIWI-piRNA pathway activity in fetal testis. (A) Schematic of xenotransplant model with timepoints examined for n=2 biological repeats. The GW17 sample is shown, whereas the GW16 sample (blue italic text) is depicted in Fig. S8. (B) Immunostaining for HIWI2, L1-ORF1p and VASA (shown in merge with DAPI) at GW17 (no xenograft; top) and GW17+4 weeks xenograft (bottom). Scale bars: 20 μm. (C) Quantification of HIWI2 subcellular localization in VASA+ cells of xenografted testes. Two-tailed Fisher's exact test was performed on ‘nuclear’ and grouped ‘non-nuclear’ categories across two time points. (D) Quantification of L1-ORF1p intensity normalized to VASA; Mann-Whitney U-tests were used to test significance. (E) Manual scoring of L1-ORF1p expression in VASA+ cells grouped into one of four categories: cytoplasmic staining; punctate cytoplasmic staining (either one puncta or multiple puncta); or no L1-ORF1p expression. Two-tailed Fisher's exact test was performed on the categories ‘no L1-ORF1p’ versus all grouped ‘L1-ORF1p-expressing’ cells across two time points to determine significance. (F) Immunostaining for 5mC, HIWI2 and VASA in fetal testis at GW17 and xenografts. VASA+ cells are outlined. Scale bars: 10 μm. (G) Immunostaining for H3K9me3, L1-ORF1p and VASA (shown in merge with DAPI) at GW17 and xenografts. Filled and empty arrowheads indicate high and low H3K9me3, respectively. Scale bars: 10 μm. (H) xy scatter plots of H3K9me3 and L1-ORF1p fluorescence intensities with Pearson's correlation coefficients, P values and number of cells counted. (I) Quantification of H3K9me3 intensity normalized to VASA, measured in Volocity. Mann-Whitney U-tests were used to test significance. For all graphs, ****P<0.0001; n.s., not significant; n represents number of individual cells counted per time point.

