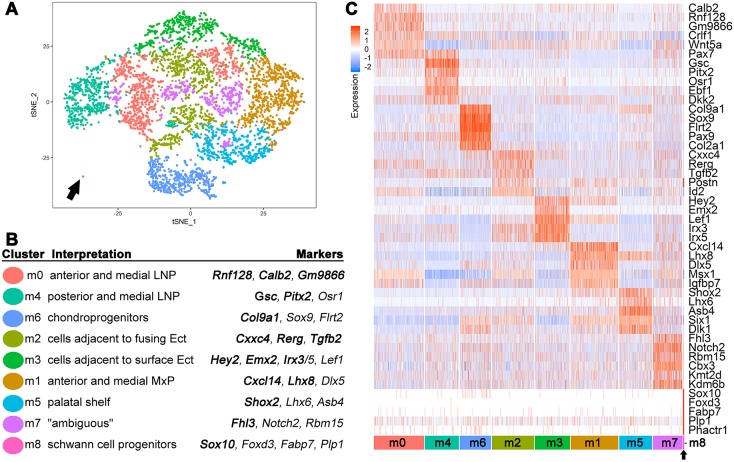
Fig. 2.
Reclustering identifies specific mesenchymal cell populations. (A) tSNE plot of reclustered mesenchymal cells from CrectLJ dataset. (B) Annotation of the re-clustered mesenchyme showing marker genes used for mapping and assignment. Genes in bold were used for in situ hybridization (Figs 3, 4, Figs S5, S6). Ect, ectoderm. (C) Heatmap representing scaled expression level (blue to red) of representative marker genes across the mesenchymal cells. Each row is a gene while each column is a cell. The bottom row demarcates the cell clusters. Black arrow indicates the smallest cluster (m8) in both A and C.

