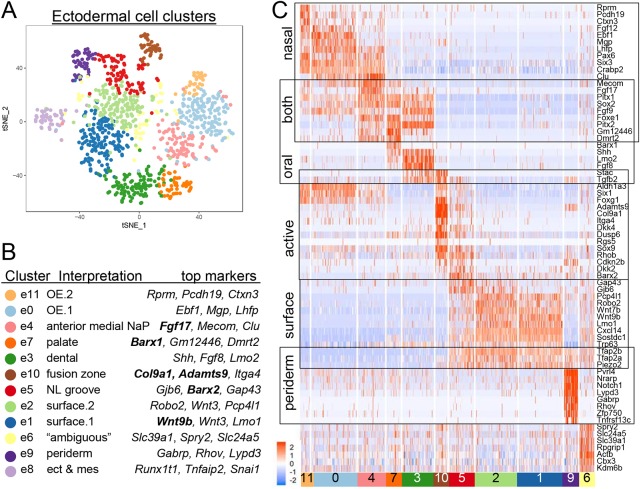
Fig. 5.
Reclustering identifies specific ectodermal cell populations. (A) tSNE plot of reclustered ectodermal cells from Fig. 1. (B) Summary of cluster-specific marker genes and interpretation/anatomical mapping. Genes in bold were used for in situ hybridization (Fig. 6, Fig. S7). (C) Heatmap representing scaled expression level (blue to red) of representative marker genes across the ectodermal population. Each row is a gene and each column is a cell. The bottom row demarcates the cell clusters (e8 cluster is omitted). The boxes indicate anatomically related groups of the clusters. ect, ectoderm; mes, mesenchyme; NL groove, nasolacrimal groove; NaP, nasal pit; OE, olfactory epithelium.

