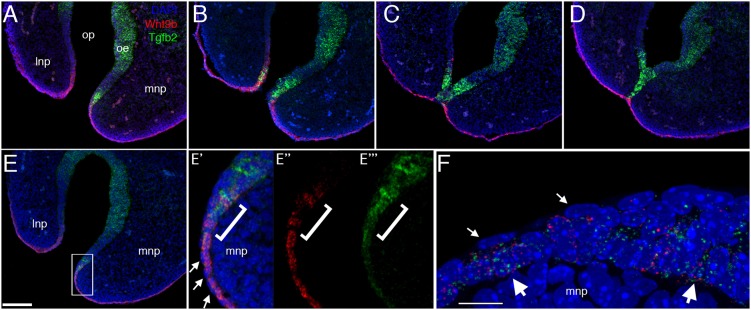
Fig. 7.
Tgfb2 marks basal cells at the fusion zone. (A-F) RNAscope analysis of Tgfb2 (green) and Wnt9b (red) expression during fusion between the MNP and LNP, with DAPI marking nuclei (blue). (A-D) 14 μm frontal plane serial sections from tip of the nose through base of nasal pit showing (A) seven sections anterior (distal), (B) immediately anterior, (C) immediately behind (posterior) and (D) six sections posterior to the fusion front. (E) Tgfb2 expression is first detected in the MNP approximately seven or eight sections anterior (distal) to the fusion front. The boxed area in E is shown at higher magnification in E′-E″, with overlap of Tgfb2 and Wnt9b expression bracketed. (F) At higher resolution (0.5 µm optical sections), Tgfb2 and Wnt9b RNAs are seen in the same cell nuclei (large white arrows). Small white arrows in E and F show that these genes are not expressed in the flattened nuclei of the overlying periderm. Scale bars: 100 µm in A-E; 10 µm in F.

