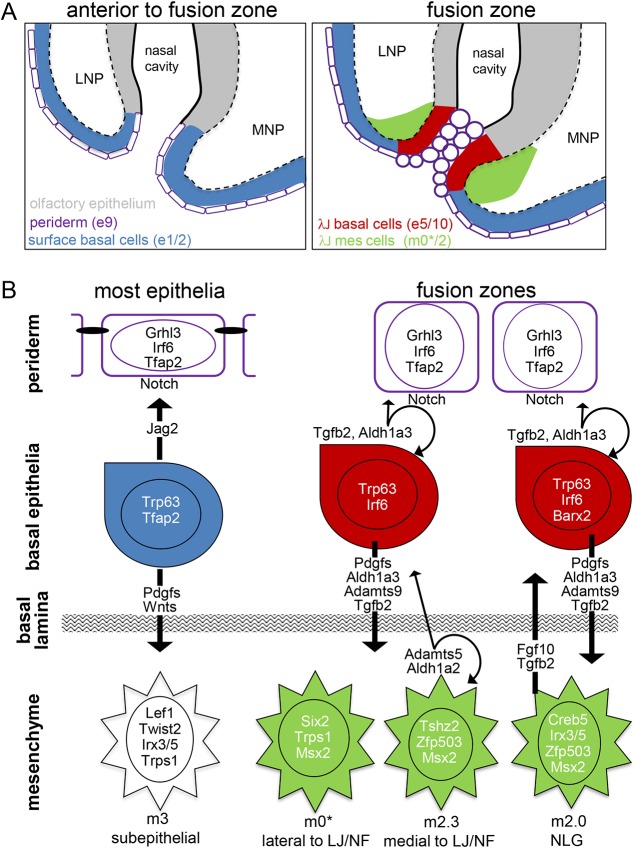
Fig. 9.
Model for fusion zones. (A) Diagram showing cell populations that are either anterior to (left panel) or within (right panel) the fusion zone of the lambdoid junction. The relevant tissue layers and clusters associated with the fusion front are colour coded and the white dashed lines represent the boundary between ectodermal and mesenchymal layers. Anterior to the fusion zone, the periderm has a flattened morphology. As fusion initiates, the periderm cells adopt a rounded appearance and the underlying basal ectodermal cells and adjacent mesenchymal cells adopt new gene expression programs. (B) The left schematic shows tissue away from the fusion sites. Flattened periderm connected by apical junctions (black ovals), potentially maintained by Jag2/Notch signalling. Basal cells signal to both the overlying periderm and underlying mesenchyme with a prominent Wnt signature. The right schematic shows fusing tissue at either the lambdoid junction (LJ) and nasal fin (NF) or the nasolacrimal groove (NLG). Periderm is rounded and lacks polarized junctions. The associated basal cells have largely re-tooled their signalling repertoire, replacing Wnts with Tgfb2 and with downregulating Jag2 expression, although Jag1 expression is maintained. Additionally, the basal cells express ECM remodelling enzymes such as Adamts9, which may indicate altered interaction with the basal lamina. At the transcriptional level, basal cells have lower Tfap2 and higher Irf6 levels, as well as raised Barx2 around the NLG. The mesenchyme underlying each of the fusion sites is unique, with different suites of transcription factors and signalling molecules, with Aldh1a2 at the NF and Fgf10 at the NLG. Colour coding is same as in A, except that grey hatching shows basal lamina.

