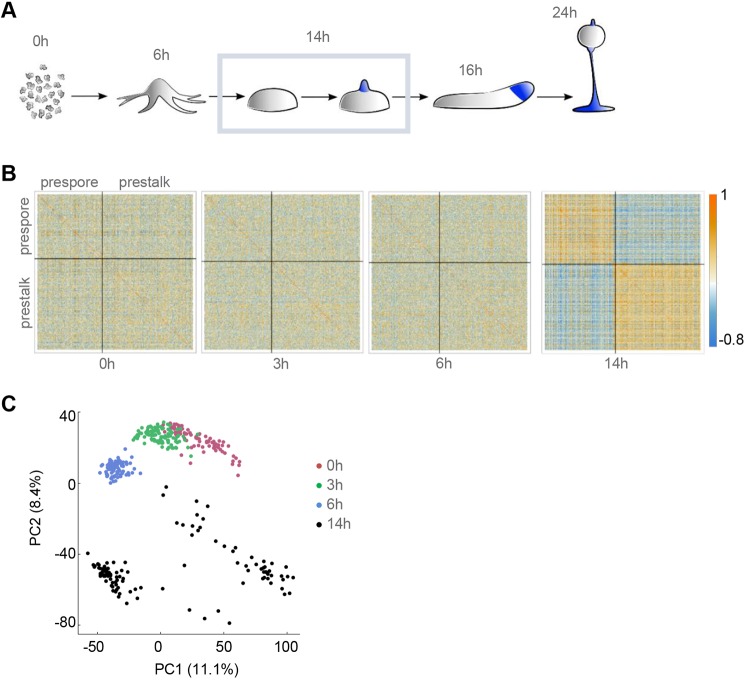
Fig. 1.
Cell type divergence in Dictyostelium aggregates. (A) Schematic of Dictyostelium development. Single cell transcriptomics was carried out on 116 cells, over three replicates, at the mound stage (outlined). (B) Patterns of correlation within lineage-specific genes. Correlation heatmaps, split into prespore and prestalk genes, are shown for 0, 3, 6 and 14 h timepoints. We selected cell type-specific genes from the data of Parikh et al. (2010) with |log2FC|>1, FDR<0.1 and an expression level of at least 100 normalised read counts, in at least one cell. (C) PCA of individual cell transcriptomes reveals distinct subpopulations at the mound stage. Shown here are the first two principal components. Each dot is a cell, colour-coded by developmental time.

