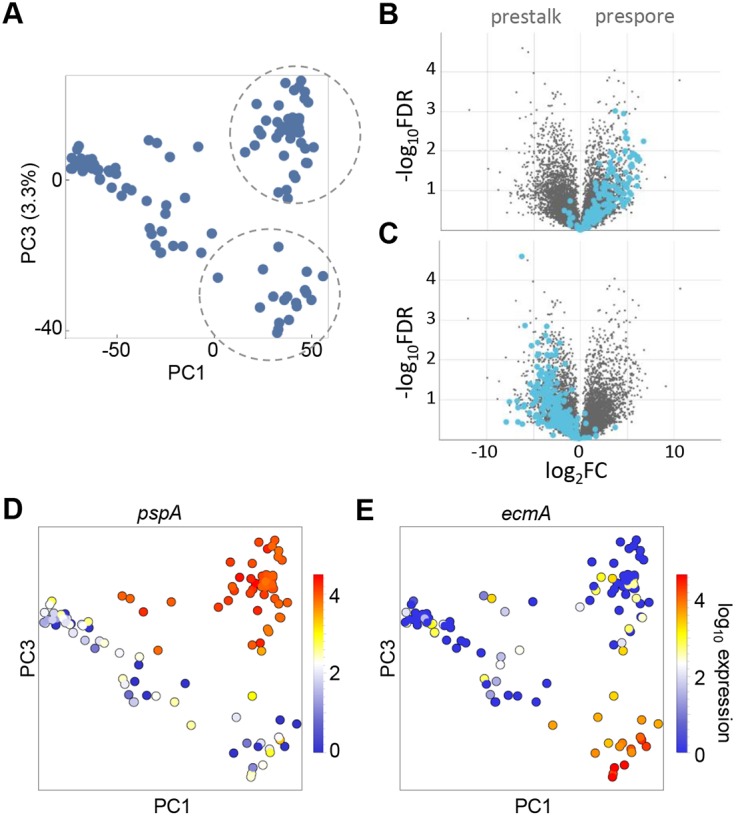
Fig. 3.

Identification of prespore and prestalk populations in late mounds. (A) The identification of cell type-specific subpopulations in mounds requires analysis of higher order principal components. Each dot is a cell shown in the PC3 versus PC1 space, with PC1 used as a proxy for developmental time. Distinct clusters separate at high values of PC1 (encircled). (B) Genes with high positive loadings in PC3 are strongly enriched for prespore markers, as shown in the volcano plot. (C) Genes with negative PC3 loadings are enriched in prestalk markers. Volcano plots labelled using dictyExpress (Stajdohar et al., 2017). (D,E) Expression of standard cell type-specific markers pspA and ecmA validates the clusters that are separated in PC3 as prespore and prestalk. Each dot is a cell coloured by the level of expression of pspA or ecmA. The prespore marker pspA is enriched in the population that was identified as prespore in B, and a few cells from earlier in development (D). The prestalk marker, ecmA, is enriched in the population that was identified as prestalk in C (E).
