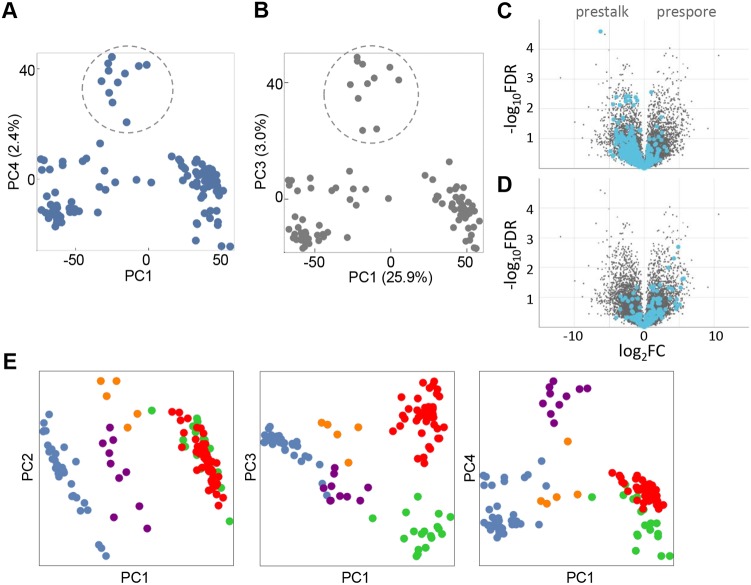
Fig. 4.
Identification of an early intermediate in prestalk differentiation. (A) Identification of a population (encircled) of intermediate developmental progression with high values of PC4. PC1 is used as a proxy for developmental time. (B) PCA on the mound population after masking of prestalk cells from the analysis, with the same population encircled as in A. (C) After masking the stalk population, genes with high positive loadings in PC3 are enriched in prestalk markers, as shown by the volcano plot. (D) After masking the stalk population, genes with negative loadings in PC3 are enriched in prespore markers. (E) Visualising cell fate separation in the first four principal components. Individual cells are coloured based on their cell-type: unspecified early mound (blue), early prestalk (purple), early prespore (orange), prespore (red) and prestalk (green).

