Fig. 6.
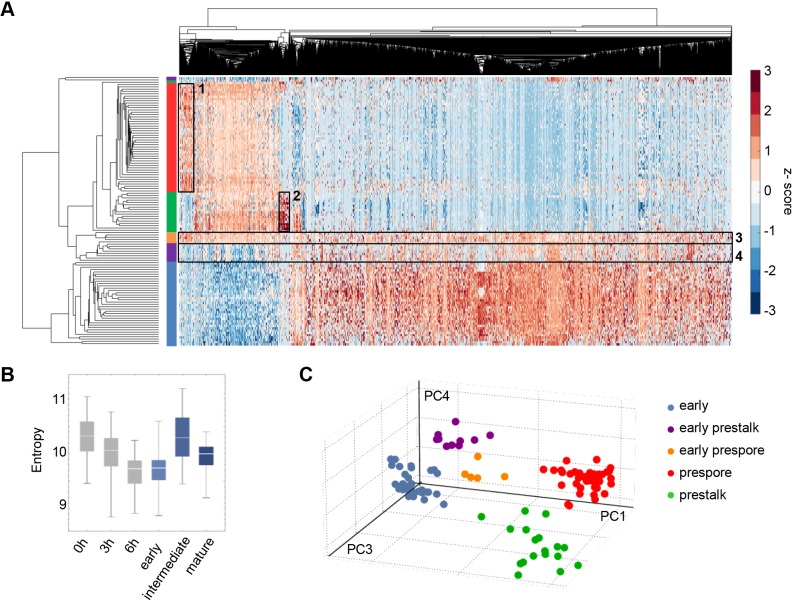
Sharp genome-wide expression transitions shared between cell fates. (A) Hierarchical clustering of single cell transcriptomics data. The rows of the heatmap represent cells, with the ends of the clustergram branches coloured in the same way as in Fig. 4E – early mound (blue), early prestalk (purple), early prespore (orange), prestalk (green) and prespore (red). The columns of the heatmap represent 5229 genes. Clusters of cells correspond to the cell groups identified by PCA. The lower cluster in the plot represents the early mound cells (blue). The middle cluster contains the two intermediate populations (purple and orange), both still transcribing genes that are typical of early cells and starting to express genes that are typical of mature prestalk and prespore cells. Prestalk and prespore cells (green and red, respectively) segregate into two separate groups, with fate-specific gene clusters outlined by boxes (1, prespore specific; 2, prestalk specific). (B) High transcriptome entropy of the intermediate cells corresponds to the observation in A that transcript expression is more uniformly distributed across the transcriptome of the intermediate subpopulations (outlined by boxes 3 and 4). For comparison, 0, 3 and 6 h timepoints are in grey. (C) Evidence for discontinuous developmental progression in the mound. Pseudo-3D projection of cells in PC4/PC3/PC1 space shows separation of cell clusters.

