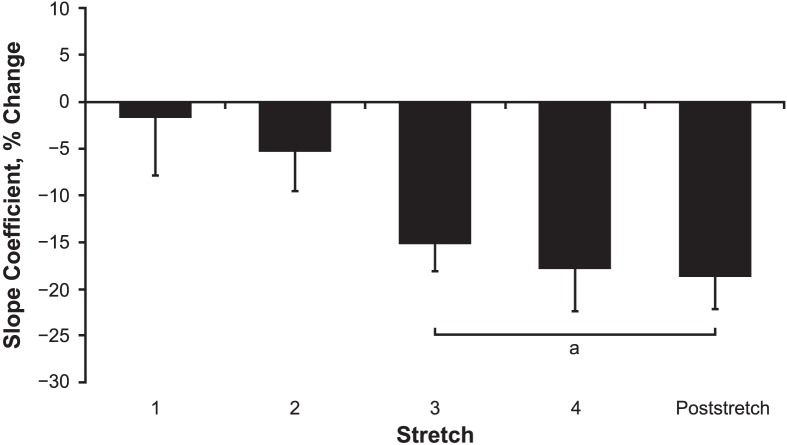
Figure 3.
Percentage change in the slope coefficients (collapsed across phase) from the prestretching assessment for the angle-torque curves generated at the beginning of stretches 1, 2, 3, and 4, as well as the poststretching assessment. Values are mean ± SEM. a Decrease from the prestretching assessment.

