Figure 4.

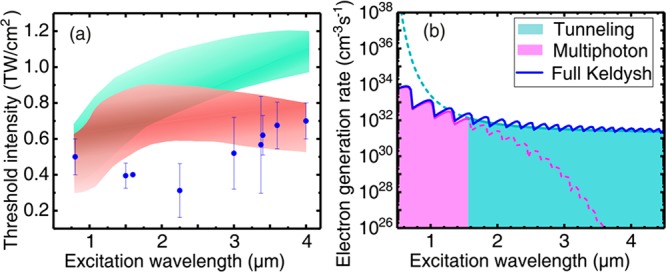
(a) Threshold pumping intensity as a function of the pumping wavelength measured experimentally (blue dots) and simulated numerically for the same experimental parameters using the model without FCA (greenish band) and including FCA and impact excitation (red band). The bands mark the range of threshold intensities calculated for the range of pump pulse duration used in the experiments. (b) Strong field excitation rate as a function of the laser wavelength calculated by applying Keldysh’s theory for the fixed intensity 0.6 TW/cm2. The magenta curve shows the asymptotic solution for multiphoton excitation rate, the aquamarine curve is the asymptotic solution corresponding to tunnel excitation rate, the blue solid line is the excitation rate calculated using the exact Keldysh formula (see Supporting Information). The color filling under the curves marks the spectral ranges where the multiphoton (γ > 1, magenta filling) and the tunneling (γ < 1, aquamarine filling) asymptotic solutions are applicable. Solid and dashed line patterns mark the regions where the corresponding asymptotic solution follows the exact calculations and where it deviates from the exact result.
