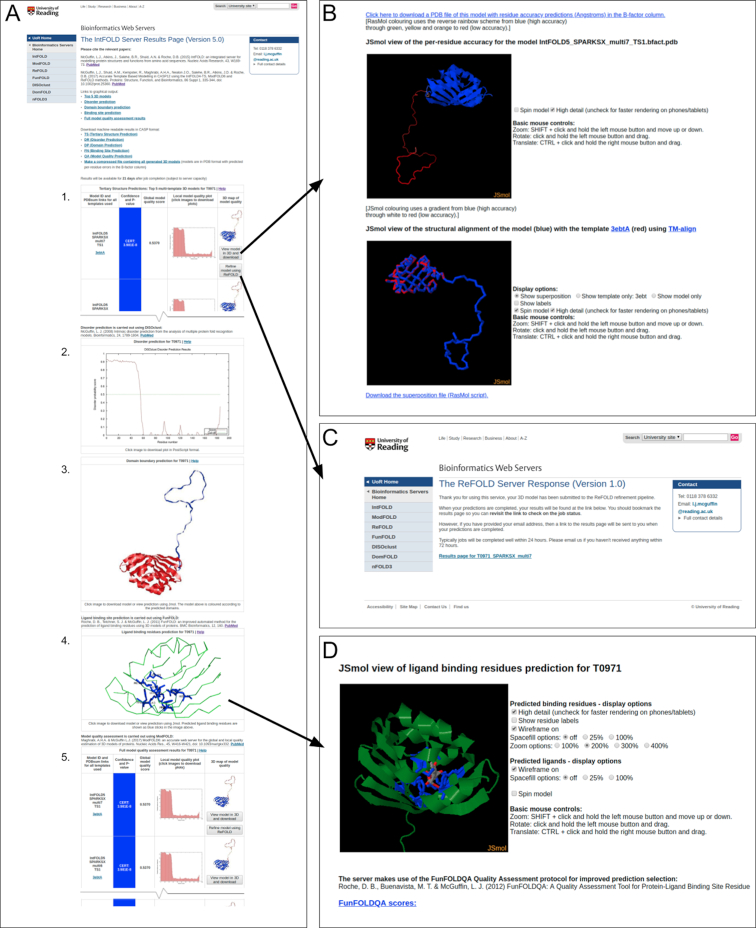
Figure 1.
The IntFOLD5 server results pages for CASP13 target T0971. (A) Graphical output from the main results page showing (from top to bottom): 1. The table with the top 5 selected 3D models and scores (table truncated here to fit); 2. The prediction of natively unstructured/disordered regions; 3. The predicted structural domain boundaries; 4. The ligand binding site prediction; 5. The full model quality rankings for all generated models (table truncated here to fit). The arrows point to additional pages that are linked to when users click on images/buttons on the main page. (B) Clicking the button titled ‘View model in 3D and download’ leads to dynamically generated pages showing interactive views of the model, and structural superpositions of the model with relevant template/s, which can be manipulated in 3D using the JSmol/HTML5 framework (http://www.jmol.org/) and/or downloaded for local viewing. (C) Clicking the button titled ‘Refine model using ReFOLD’ submits the 3D model to the ReFOLD service (21) for refinement guided by accurate quality estimates. (D) Clicking on the image of the ligand binding site prediction links to a dynamically generated page that provides numerous options for interactively viewing the likely protein–ligand interactions in 3D with JSmol.

