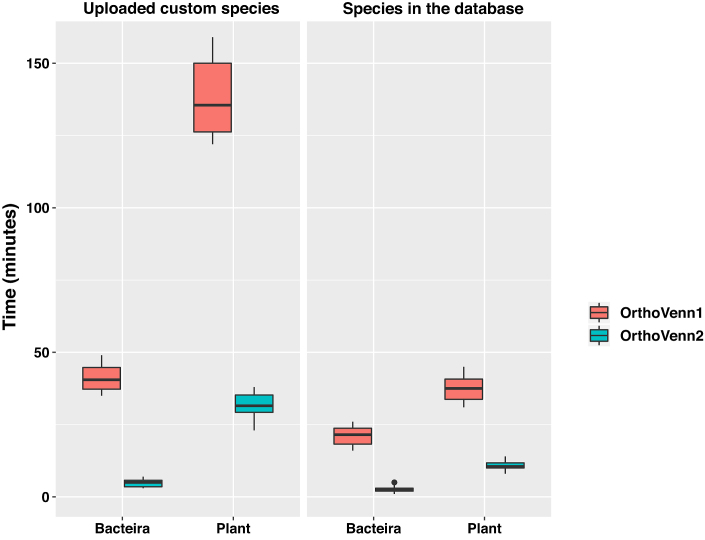
Figure 1.
Speed comparison of OrthoVenn1 and OrthoVenn2. Boxplots of median time lapse per job for OrthoVenn1 (red) or OrthoVenn2 (Green). The boxplots indicate the median (central line), the first and third quartiles (upper and lower box bounds) and the minimum and maximum value (lower and upper whiskers).

