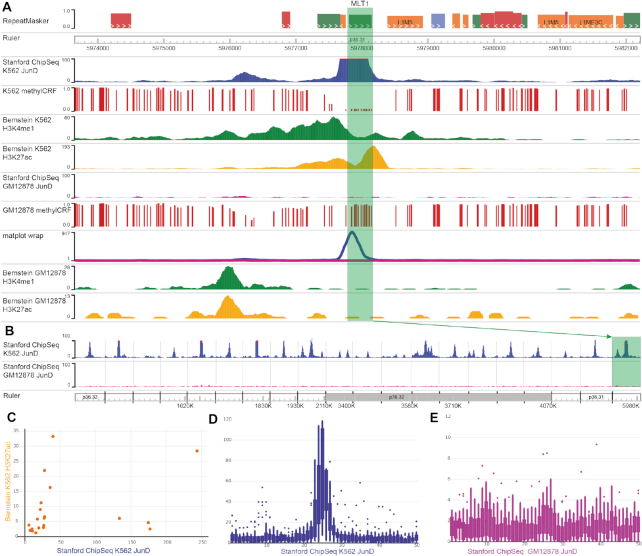
Figure 5.
Cell type-specific analysis and visualization of JunD binding on transposable elements (TEs), demonstrated in the new Browser. (A) A JunD-binding peak on an MLT1 transposable element, highlighted in green. methylCRF tracks show the predicted methylation level of CpG sites, where 0 means fully unmethylated, and 1 means fully methylated. (B) A region set view of 20 TEs shows the binding happens specifically on TE elements in the K562 sample. MLT1 is the rightmost region. (C) Scatter plot shows the relationship between mean signals for K562 H3K27ac (y-axis) and K562 JunD ChIP-seq (x-axis) in the 20 TEs. Each dot represents a TE and its flanking region. (D and E) Box plots of GM12878 (D) and K562 (E) samples indicate the average signal from 20 TEs and the regions flanking them. Each region is split into 50 bins (hence the x-axis ranges from 0 to 50), and is displayed from 5′ to 3′.

