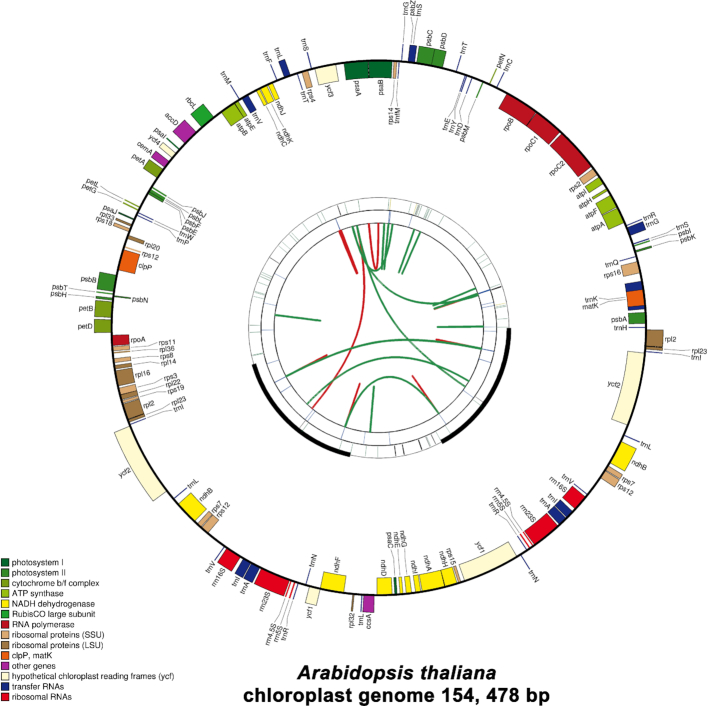
Figure 3.
Graphic representation of features identified in the plastome of Arabidopsis thaliana by using CPGAVAS2. The map contains four rings. From the center going outward, the first circle shows the forward and reverse repeats connected with red and green arcs, respectively. The next circle shows the tandem repeats marked with short bars. The third circle shows the microsatellite sequences identified using MISA. The fourth circle is drawn using drawgenemap and shows the gene structure on the plastome. The genes were colored based on their functional categories, which are shown at the left corner.

